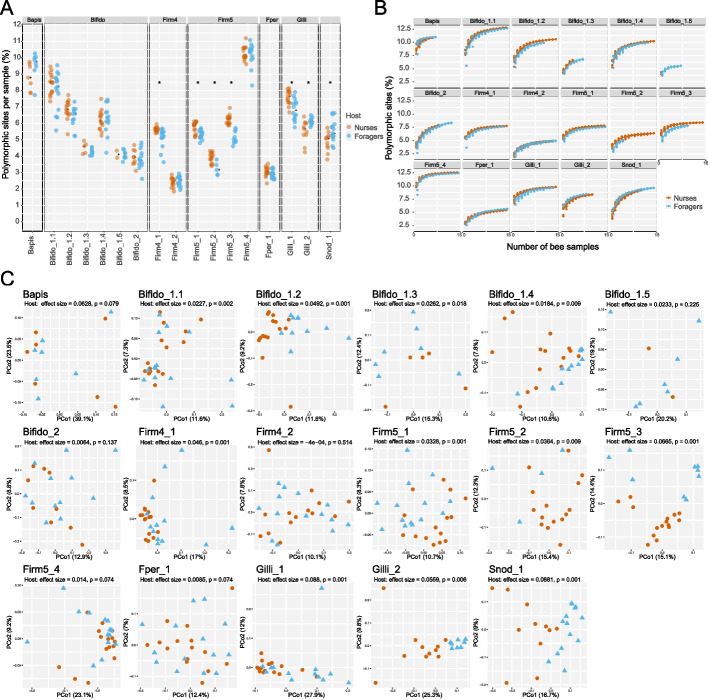
Fig. 2.
Differences in strain-level diversity between nurse and forager bees. A Proportion of polymorphic sites in the single-copy core genes for each bacterial species, expressed as a percentage of the total single-copy core genome length. Asterisks symbolize a q-value < 0.05 for the Wilcoxon signed-rank test between the proportion of polymorphic sites between nurse and forager samples. B Curves of the cumulative proportions of polymorphic sites for each species. C Principal coordinate analysis plots based on the Jaccard distance shared polymorphic sites between each pair of samples for each of the species

