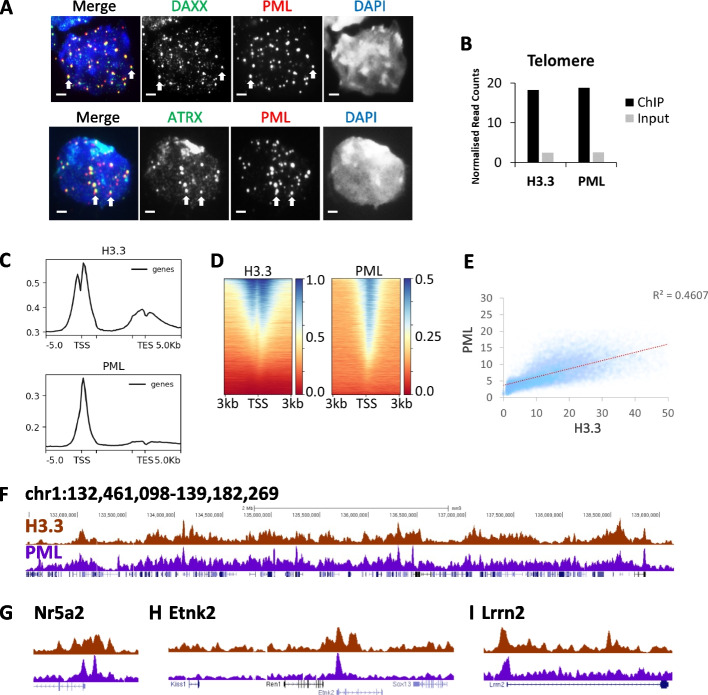
Fig. 1.
Histone H3.3 co-localizes with PML across the genome. A Immunofluorescence of PML (red) and DAXX (green) (top panel), and PML (red) and ATRX (green) (bottom panel) in WT mouse ES cells. Scale bar 2 µM. B H3.3 and PML ChIP-sequencing and input reads which map to telomere repeats. Bars represent ChIP-sequencing reads of H3.3 and PML in mouse ES cells normalized to total read count. Input sequencing shown as a control. C Composite profile of H3.3 and PML ChIP-seq reads across genes in mouse ES cells. D Heatmap of H3.3 and PML ChIP-seq reads at individual promoters [56], sorted by H3.3 enrichment. E Scatter plot of H3.3 and PML ChIP-seq reads which mapped to individual promoters, normalized for total read counts. F Representative UCSC genome browser profile of H3.3 and PML ChIP-seq (mm9, chr1: 132,461,098 – 139,182,269). G–I Zoom of promoter regions showing H3.3 and PML ChIP-seq G Nr5a2; mm9; chr1:138,666,969–138,977,687, H Etnk2; mm9; chr1:135,155,366–135,381,931, and I Lrrn2; mm9; chr1:134,680,403–135,017,359

