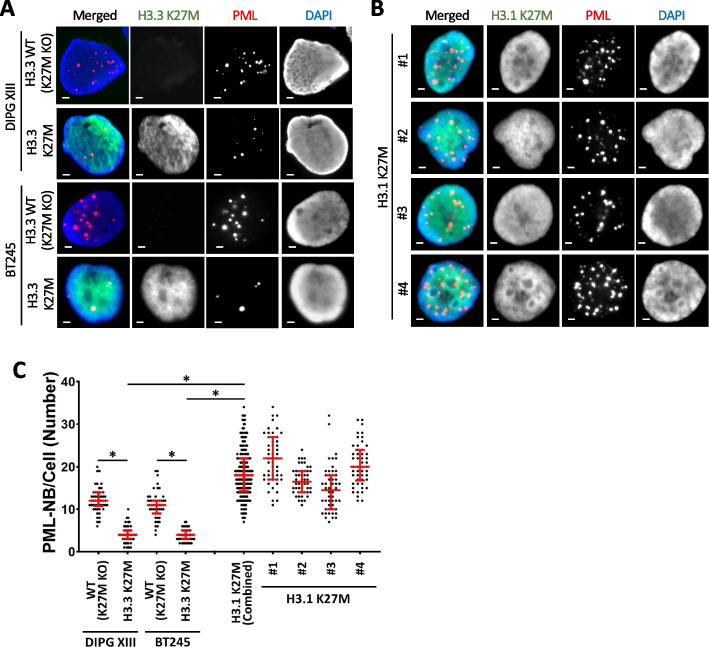
Fig. 4.
PML nuclear bodies in H3.3 K27M vs canonical H3.1 K27M mutated patient-derived glioma cells. Immunofluorescence of PML (red) and H3K27M (green) in A DIPG XIII and BT245 H3.3 K27M mutated patient-derived glioma cells compared to isogenic H3.3 WT (K27M KO) controls. B H3.1 K27M mutated patient-derived glioma cells: #1 (SU_DIPG_36), #2 (ICR_B184_2D), #3 (SU_DIPG_33), and #4 (SU_DIPG_4). Scale bar 2 µM. C Quantitation of PML-NBs per cell. 50 nuclei (n = 50) were counted from three independent immunofluorescence experiments per cell line. Dots represent counts per cell (WT (K27MKO); H3.3 K27M in DIPG XIII and BT245 cells; #1; #2; #3; #4 H3.1 K27M lines). 25th, median, and 75th percentiles are shown. H3.1 K27M (combined) shows an aggregate of all four H3.1 K27M cell lines. P-values were calculated using two-tailed Student’s t test (*P < 0.0001)

