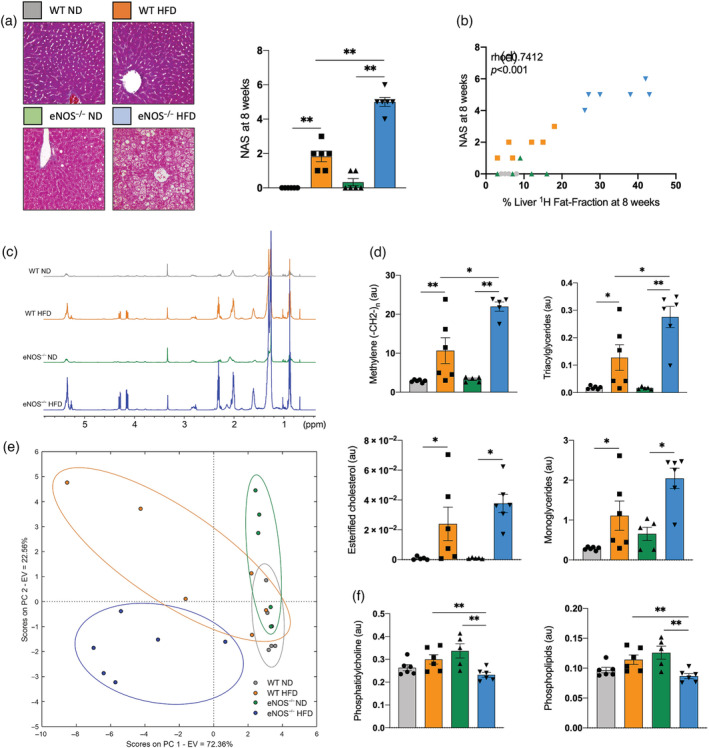
FIGURE 2.

Increased NAS and altered lipid liver composition in eNOS−/− mice fed a Western, high‐fat diet (HFD) compared with eNOS−/− mice fed a ND and WT mice fed a ND or a HFD. (a) Representative trichrome staining and NAS quantification of the different experimental groups (n = 6/group). (b) Correlation between liver fat fraction and NAS at the 8‐week time point (n = 6/group). (c) Examples of high‐resolution ex vivo 1H‐NMR spectra of the liver lipids extraction from WT and eNOS−/− mice fed a ND or a HFD. (d) Quantification of the methylene peak, triacylglycerides, esterified cholesterol, and monoglycerides in all groups measured by high‐resolution 1H‐NMR (n = 5–6/group). (e) PCA graph showing four clusters that correspond to the four groups studied (n = 5–6/group) using the data measured by high‐resolution 1H‐NMR. The x‐axis represents PC 1, which explains 72.36% of the total variance in the data. The y‐axis represents PC 2, which explains 22.56% of the total variance in the data. In total, the first two PCs explain almost 95% of the total variance in the data. (f) Quantification of the structural lipids phosphatidylcholine and phospholipids in all groups measured by high‐resolution 1H‐NMR (n = 5–6/group). Data are presented as mean ± SEM. Statistical differences are denoted by *p < 0.05, **p < 0.01. au, arbitrary units; eNOS, endothelial nitric oxide synthase; EV, explained variance; NAFLD, nonalcoholic fatty liver disease; NAS, NAFLD activity score; ND, normal diet; PC, principal component; PCA, principal component analysis; ppm, parts per million; WT, wild‐type.
