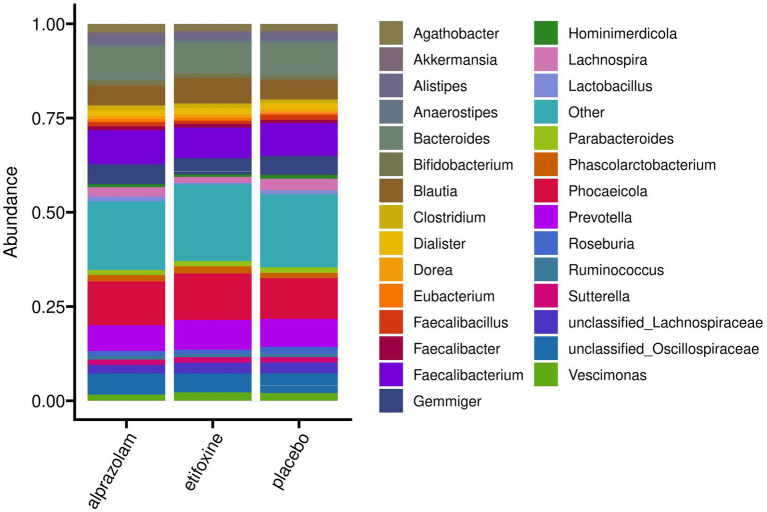
Figure 7.
Mean relative abundances on genus level of the full study cohort (N = 36) grouped according to treatment. The 30 most abundant genera are shown explicitly, while remaining taxa are comprised in “Other.” Individual bacterial compositions for each participant are shown in Supplementary Figure S5.

