
Fig. 3.
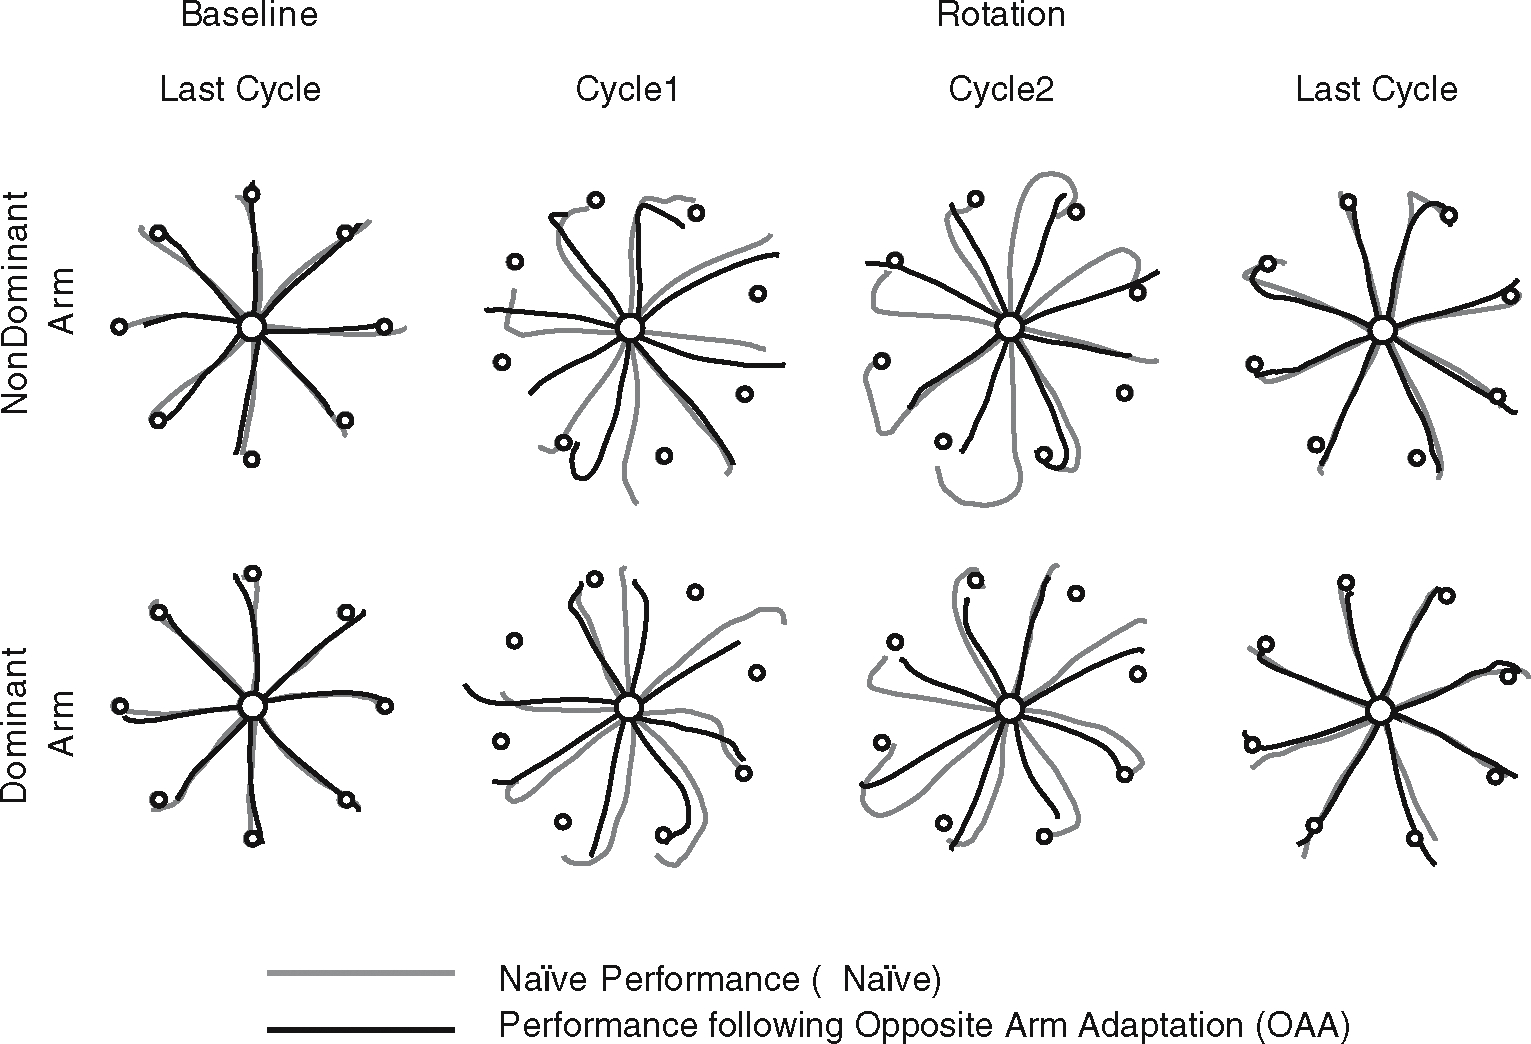
Hand-paths of representative subjects. Nondominant hand paths are shown along the top row, whereas dominant hand paths are shown below. Each column shows hand-paths of the eight consecutive trials of naïve performance (gray lines) and performance following opposite arm adaptation (black lines) for each target direction