
Fig. 3.
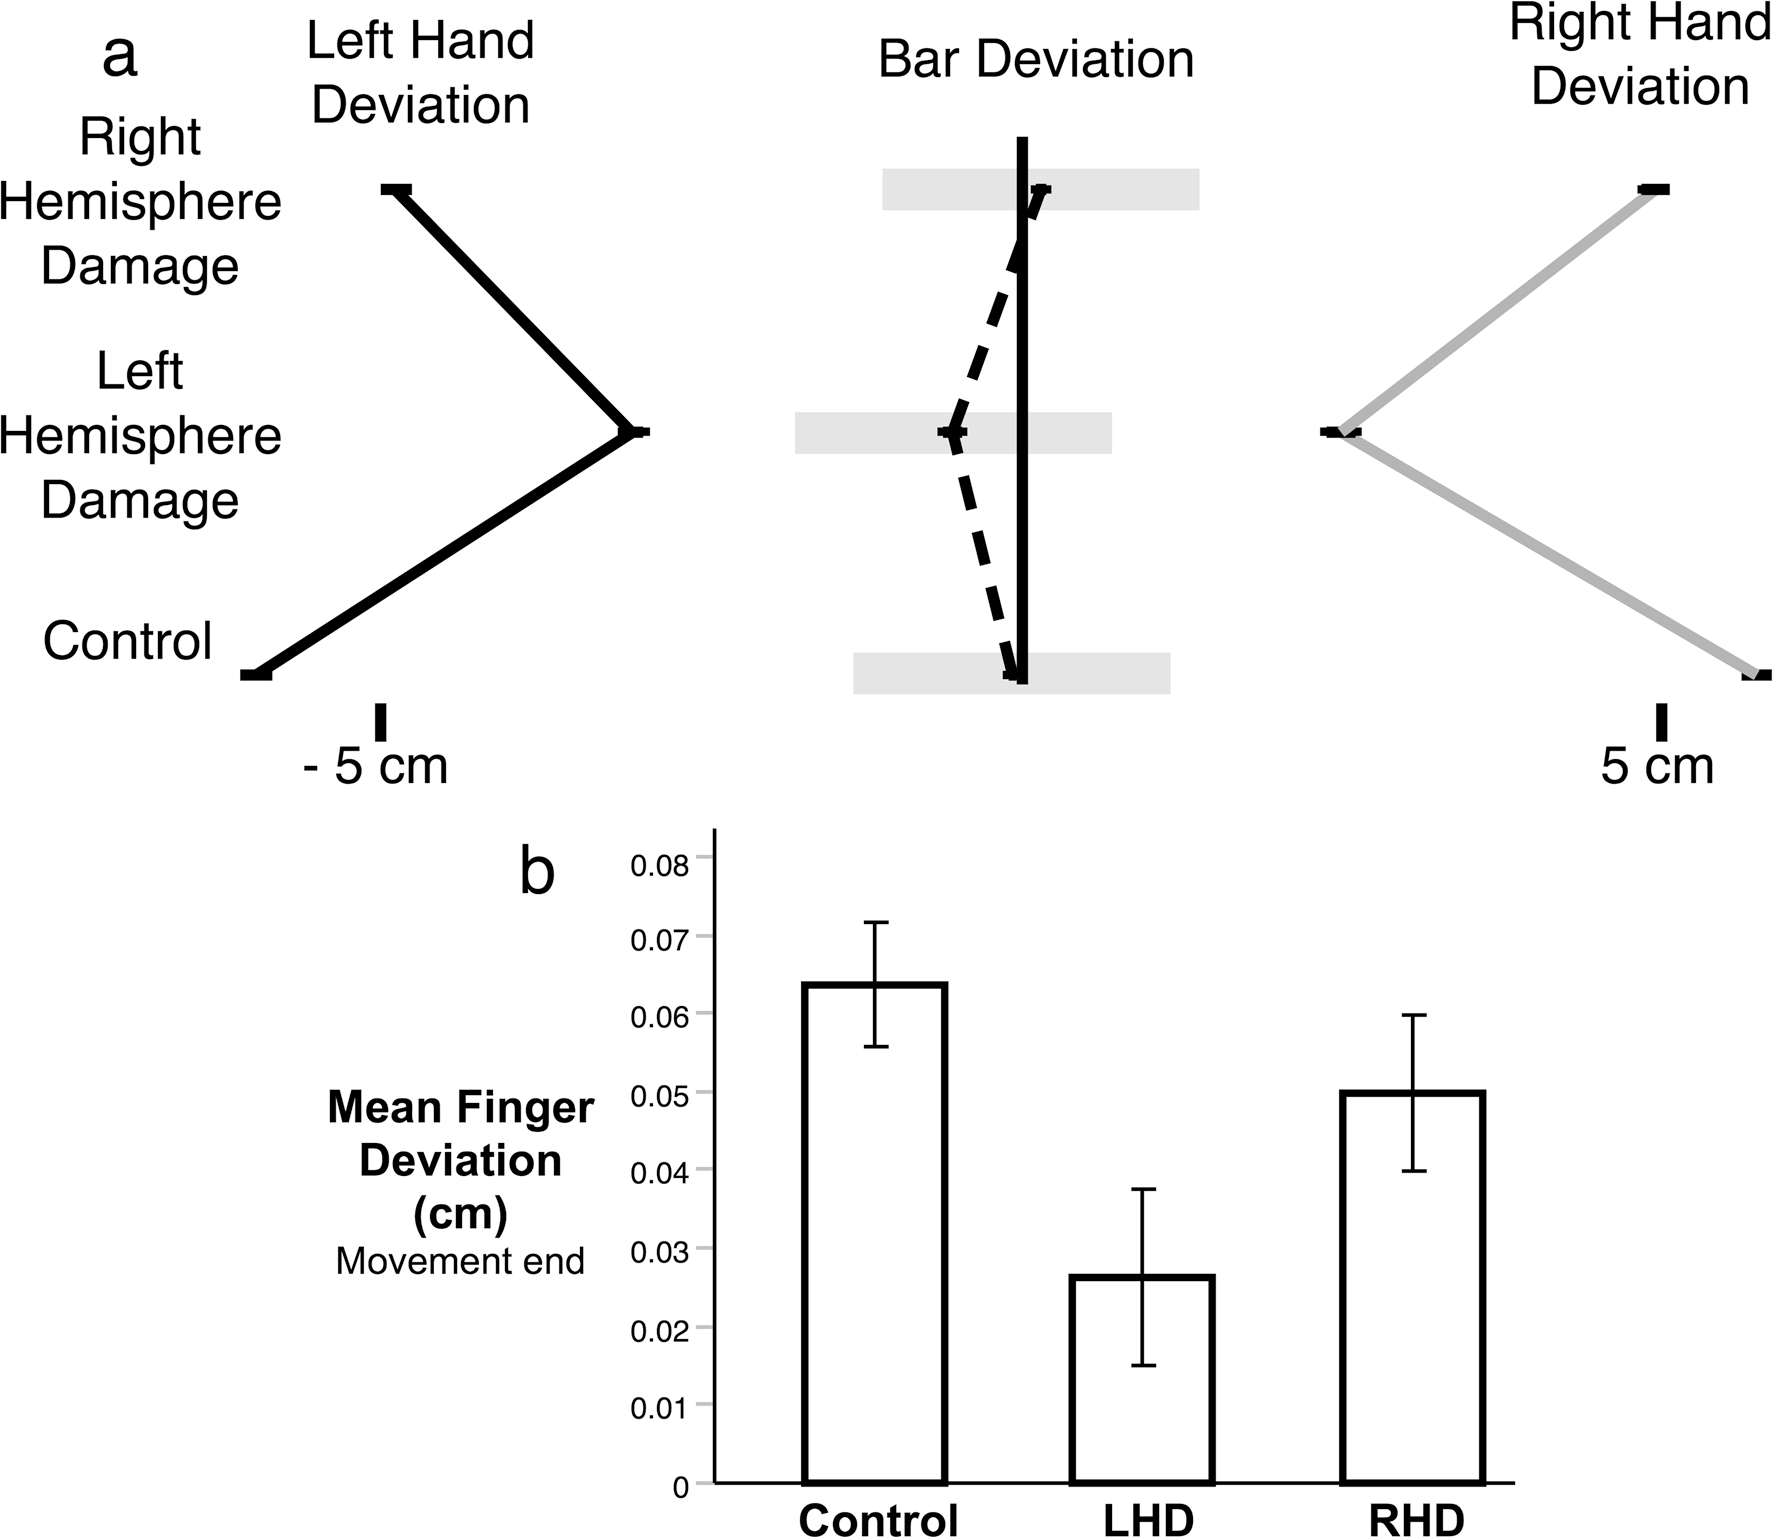
a) Scaled representation of the mean deviation of the left hand, right hand, and bar center along the x-axis of the bar for each group. b) Bar graph shows the mean deviation anlong the x-axis of the bar for each group at the end of movement
Official websites use .gov
A
.gov website belongs to an official
government organization in the United States.
Secure .gov websites use HTTPS
A lock (
) or https:// means you've safely
connected to the .gov website. Share sensitive
information only on official, secure websites.
a) Scaled representation of the mean deviation of the left hand, right hand, and bar center along the x-axis of the bar for each group. b) Bar graph shows the mean deviation anlong the x-axis of the bar for each group at the end of movement