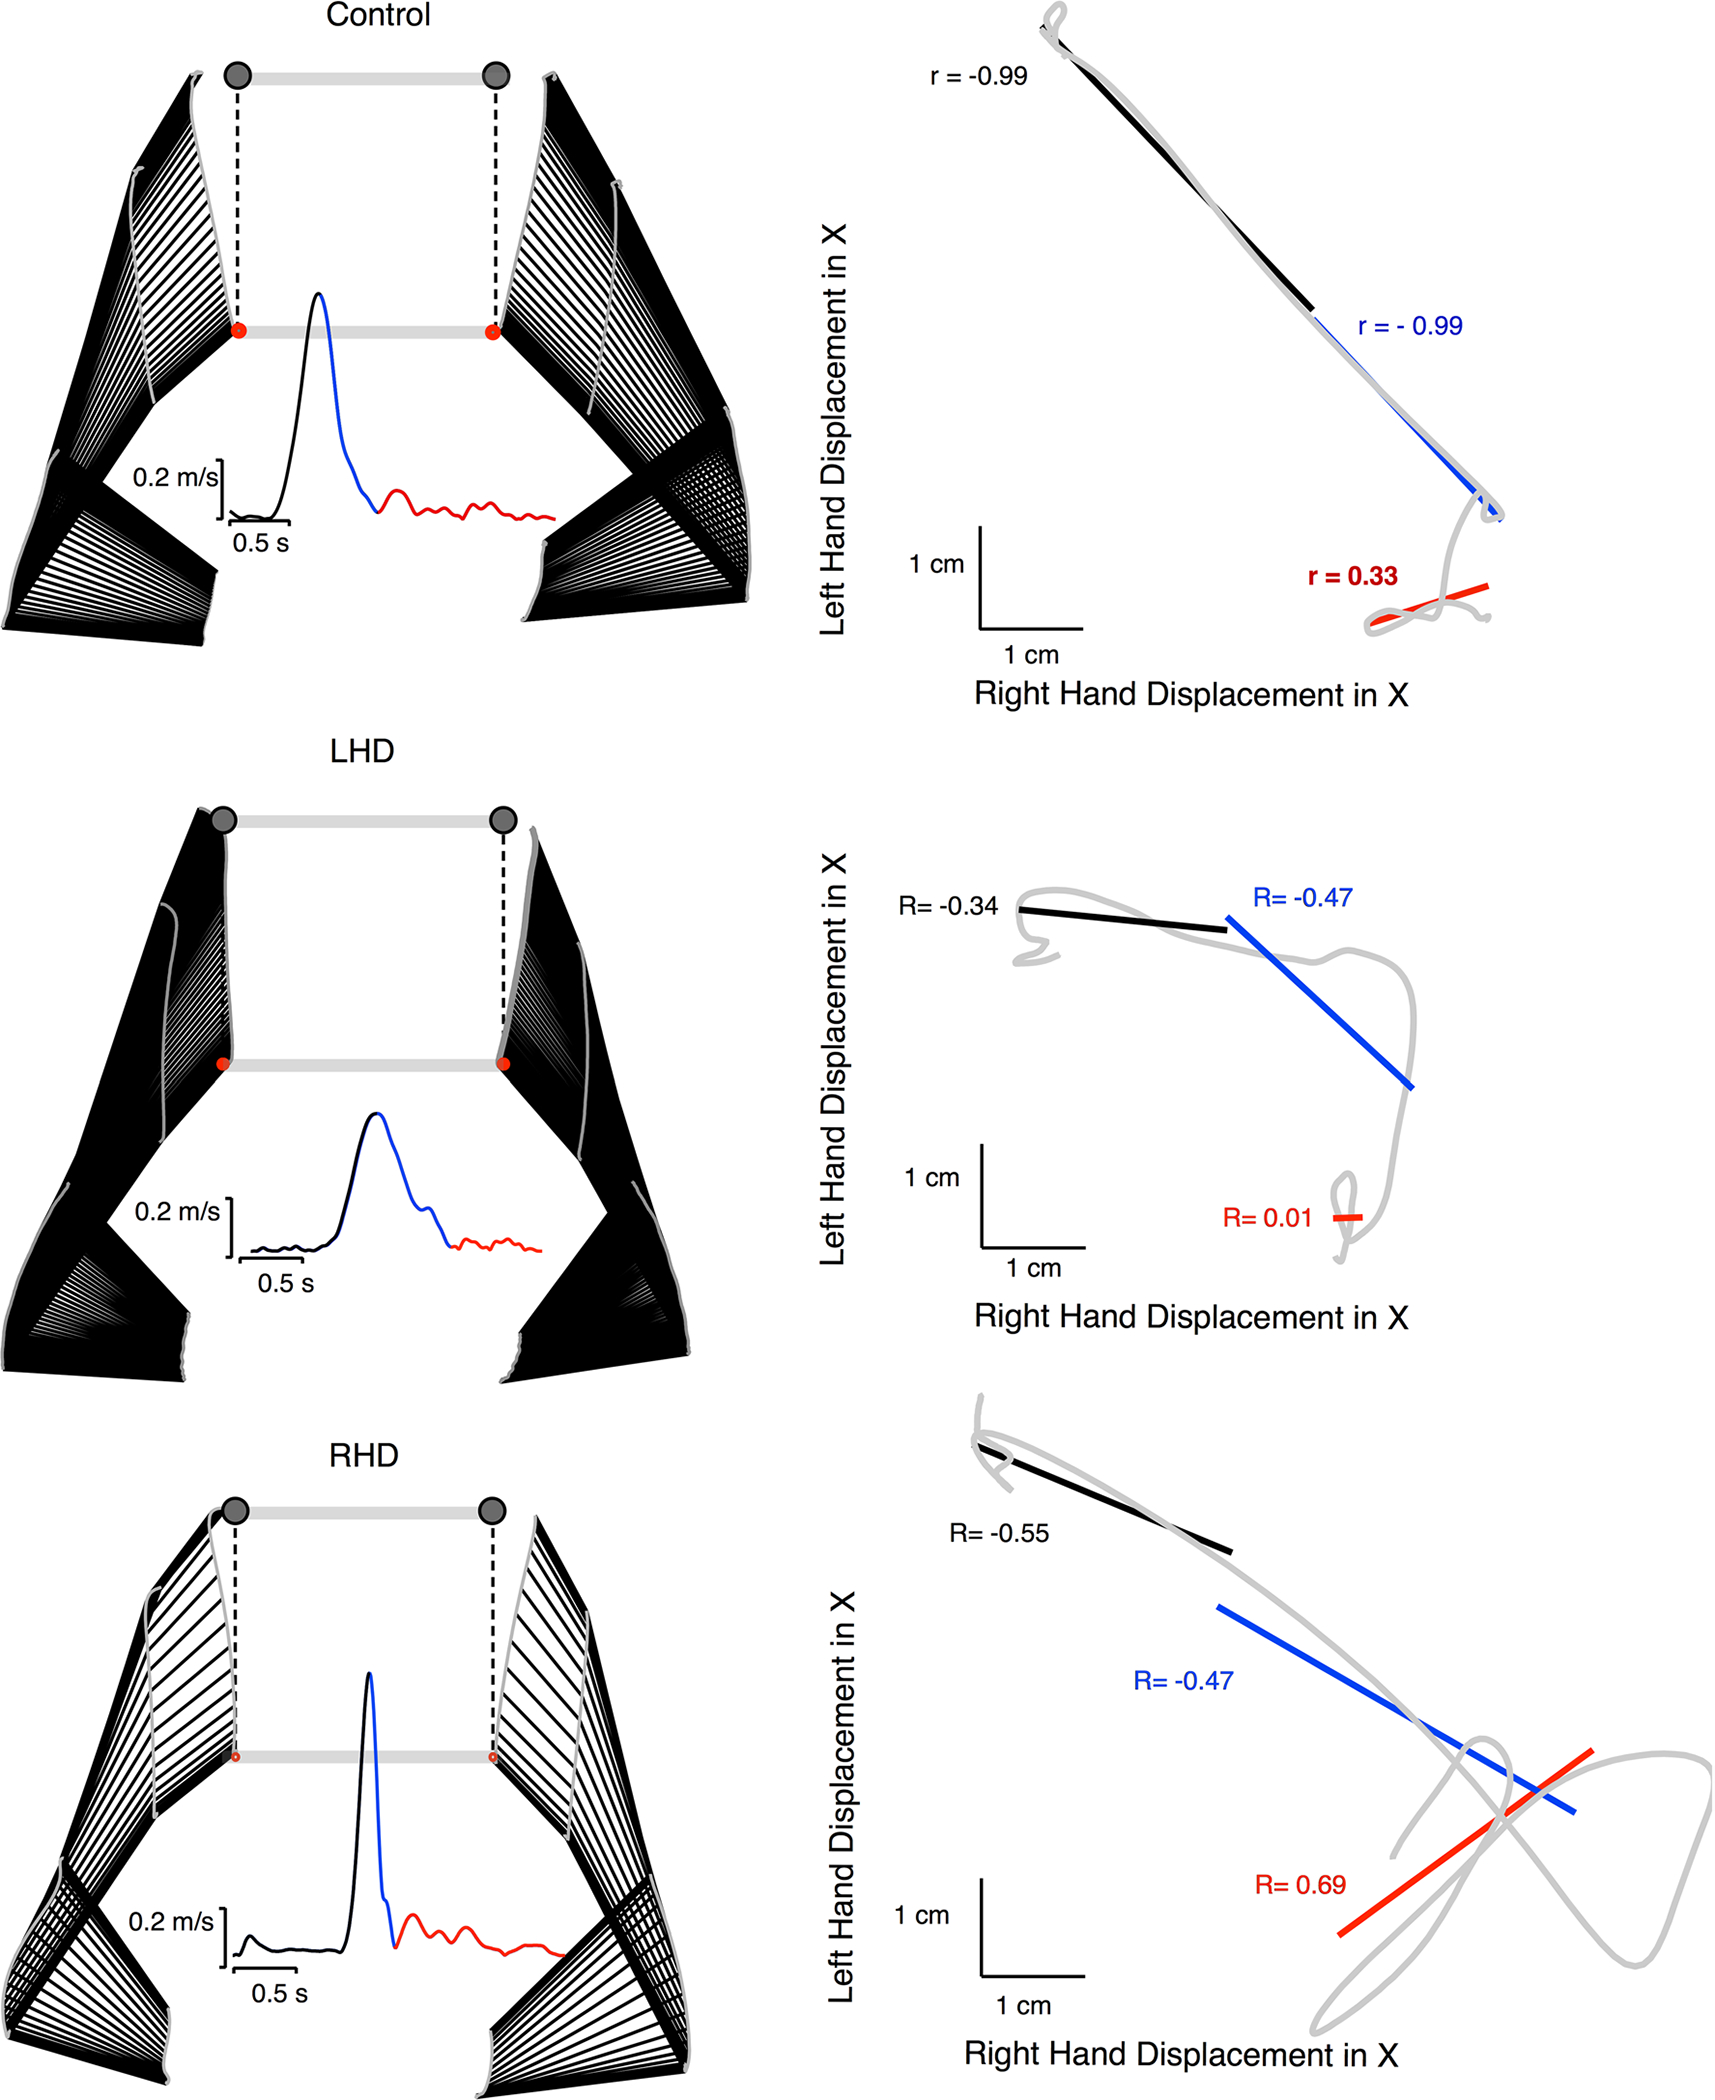
Fig. 6.

Correlations of redundant axis movements within example trials are shown for each group. Example movements and velocity profiles are shown (left) with stick figures of arm locations drawn every two data points (17.2 milliseconds). Left hand deviation in the x-axis vs the right hand deviation in the x axis are plotted in gray (right), with correlations broken into three phases represented in black (Phase 1), blue (Phase 2), and red (Phase 3)
