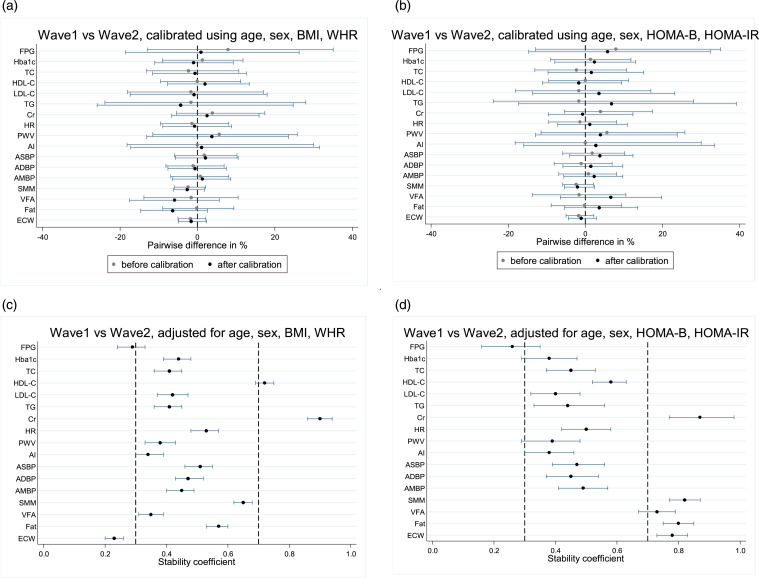
Figure 2.
Comparison of the pairwise difference (shown using median with interquartile range in A and B) and stability coefficient (shown using mean with 95% confidence interval in C and D) of the parameters between the first and second waves of SMART2D. BMI, body mass index; WHR, waist-hip ratio; FPG, fasting plasma glucose; HbA1c, haemoglobin A1c; TC, total cholesterol; HDL-C, high-density lipoprotein-cholesterol; LDL-C, low-density lipoprotein cholesterol; TG, triglycerides; Cr, creatinine; HR, heart rate; PWV, pulse wave velocity; AI, augmentation index; ASBP, aortic systolic blood pressure; ADBP, aortic diastolic blood pressure; AMBP, aortic mean blood pressure; SMM, skeletal muscle mass; VFA, visceral fat area; ECW, extracellular-to-total body water.

