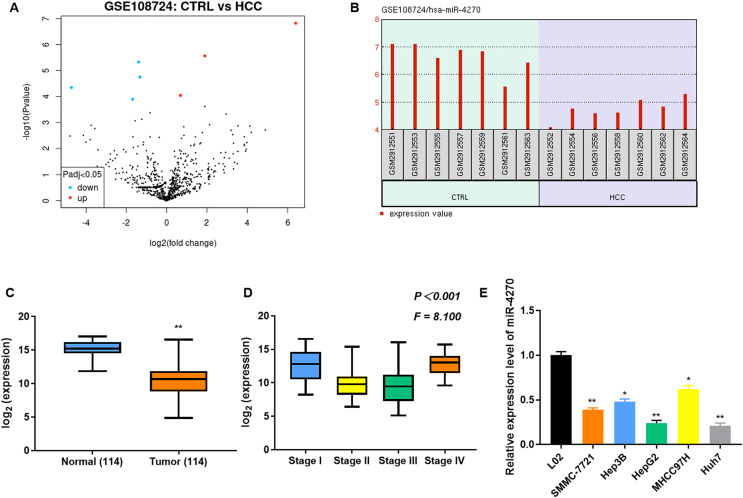
Figure 1. Downregulation of miR-4270 in HCC tissues and cell lines.
(A) Volcano plot illustrating the differential expression of genes in the GSE108724 dataset, comprising 7 HCC and seven adjacent non-tumor tissue samples. The x-axis represents the log2 (fold change). (B) Expression levels of miR-4270 in individual samples from the GSE108724 dataset. (C) Comparative expression of miR-4270 in 114 paired HCC tumor and adjacent non-tumor tissues. **P < 0.01 vs Normal, non-paired t-test. (D) miR-4270 expression analysis across different HCC clinical stages, one-way ANOVA, P < 0.001, F = 8.100. (E) miR-4270 levels in different HCC cell lines. *P < 0.05, **P < 0.01 vs L02. N = 6.

