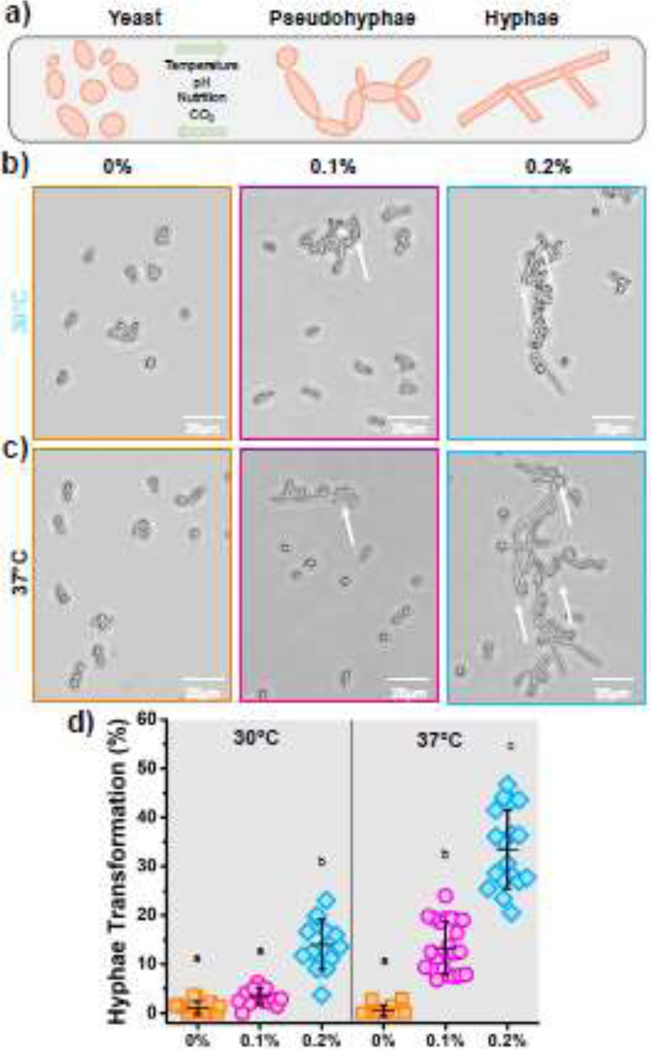
Figure 3.
Yeast-to-hyphae transition evaluations. a) Scheme of the yeast-to-hyphae morphological transition of C. albicans. b) Photomicrographs showing the morphology of C. albicans cells growing over PMMA surfaces under cyclic strain (0%, 0.1%, and 0.2%) incubated at 30°C and c) 37°C. d) Percentage of hyphae formation after 4 h of incubation. The error bars were obtained from N = 6 measurements. Means with different letters are significantly different from each other (p ≤ 0.05).

