
FIGURE 1.
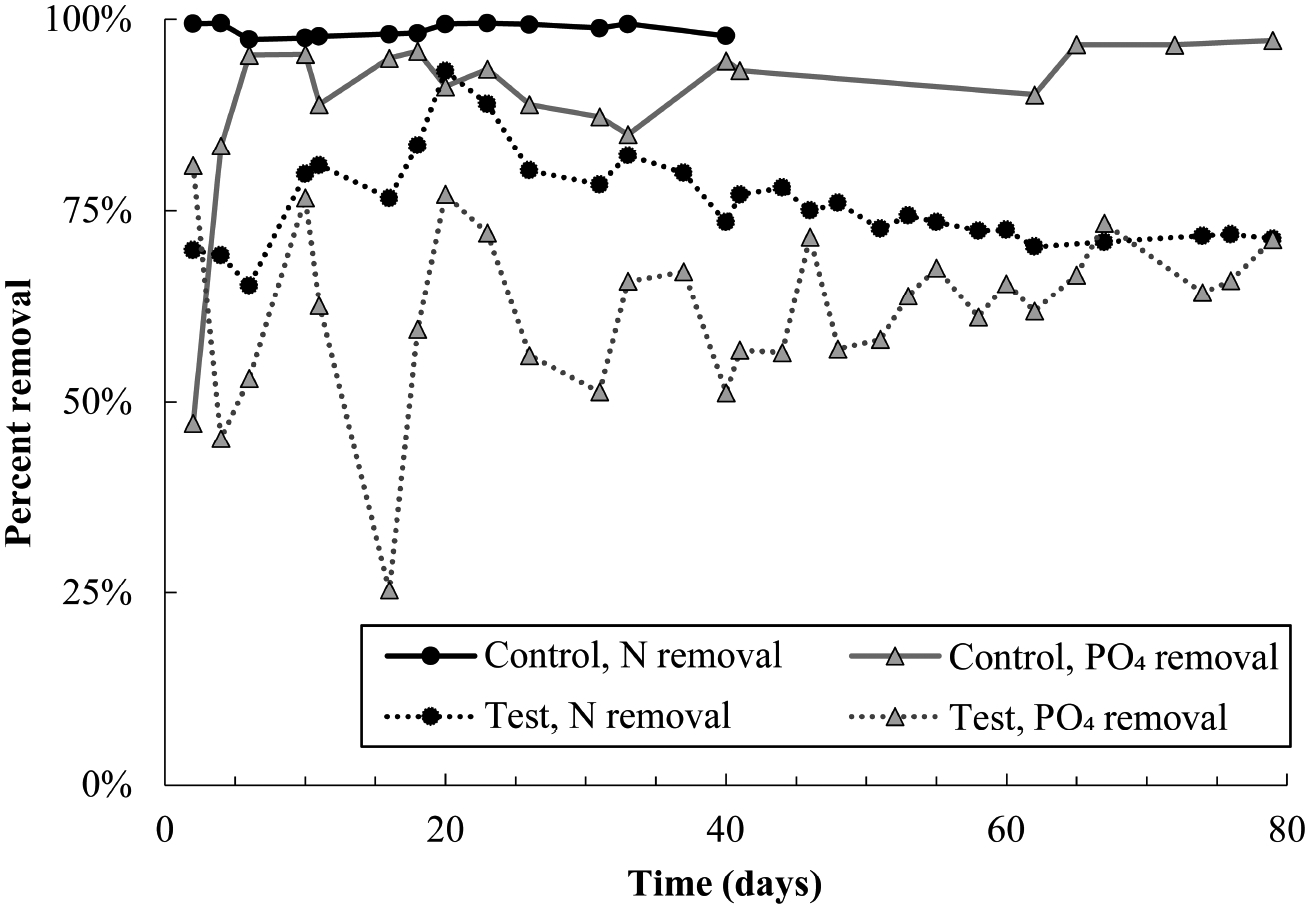
Total nitrogen and phosphate removal in the control and test SBR during the pharmaceutical dosing period. Note that N removal data in the control reactor is not plotted after day 40 because an acid overdose in the control reactor severely inhibited nitrifying populations. Given trends prior to the acid overdose, it is likely that nitrogen removal in the control would have proceeded at 100% if not for this issue. Nitrogen and phosphate removal in the test reactor averaged out at 73 ± 2% and 63 ± 6%, respectively, over the last 40 days of the experiment.