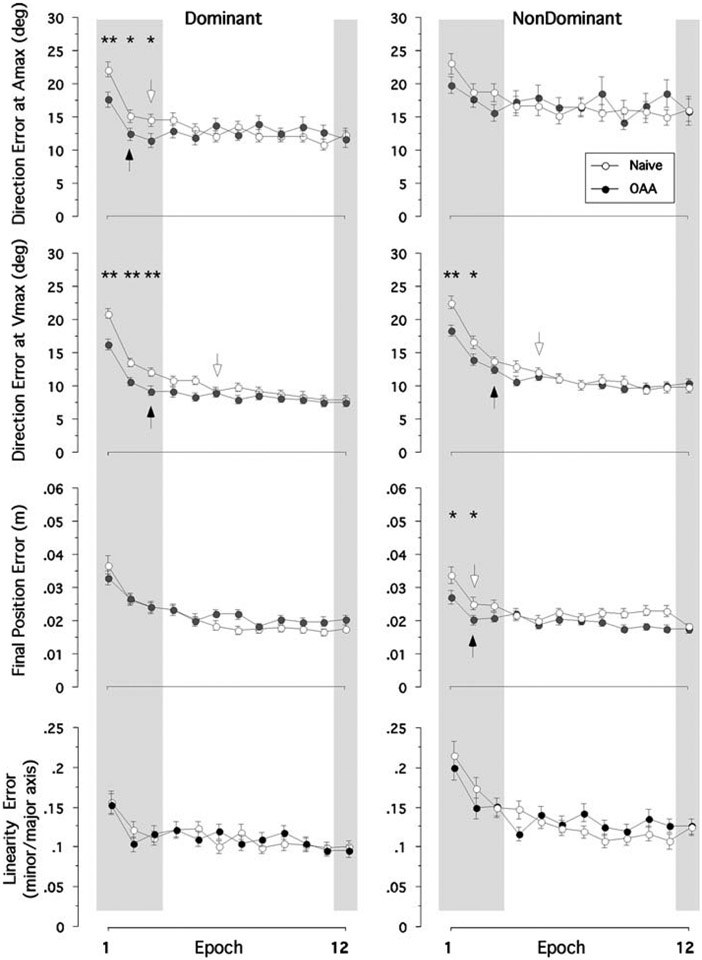
Fig. 3.
Mean performance measures of direction errors at Vmax and Amax, final position error and linearity error. Every data point shown on X axis represents the average of 16 consecutive trials (epoch) across all subjects (mean ± SE). Performance measures for naïve performance (open circles) and performance following opposite arm adaptation (filled circles) are shown separately. **Significant difference between naïve performance and performance following opposite arm adaptation (OAA) at P<0.01; *Significant difference at P<0.05. Arrows represent the first adapted epoch for each arm performance

