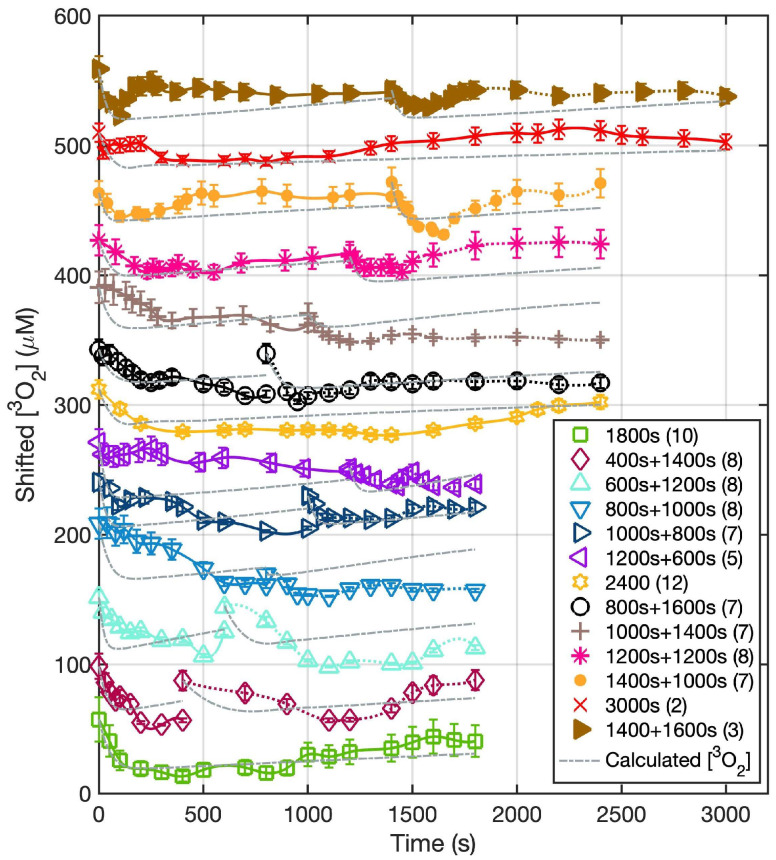
Figure 3.
The temporal changes of ground state oxygen concentration versus time at a 3 mm depth for the treatment conditions. During the 2 h dark interval, no measurement was taken. The solid lines represent the measured temporal dependence of [3O2] over the course of treatment with the symbols representing [3O2] measured at discrete time points during PDT. The grey dash lines represent the calculated oxygen concentration ([3O2]calc) at a 3 mm depth calculated using Equations (2)–(4) and the parameters summarized in Table 1. The data for all groups, except for the “1800 s” group, are shifted by 100 on the y-axis for visualization.

