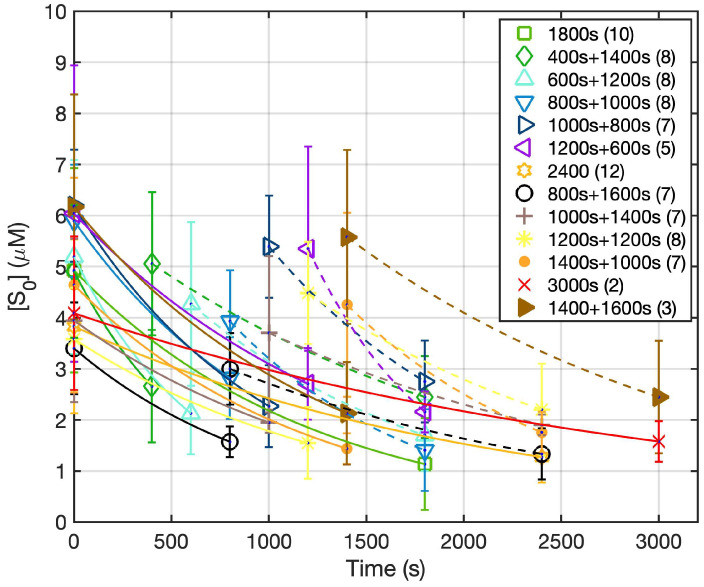
Figure 4.
The dependence of Photofrin concentration vs. time for all treatment conditions. During the 2 h dark interval, no measurement was taken. The solid curves represent calculated Photofrin concentration based on Equations (2)–(4) during PDT treatment. The solid line represents the first fractionation and the dashed lines represent the second light fractionation. The symbols represent the measured PS concentration ([S0]).

