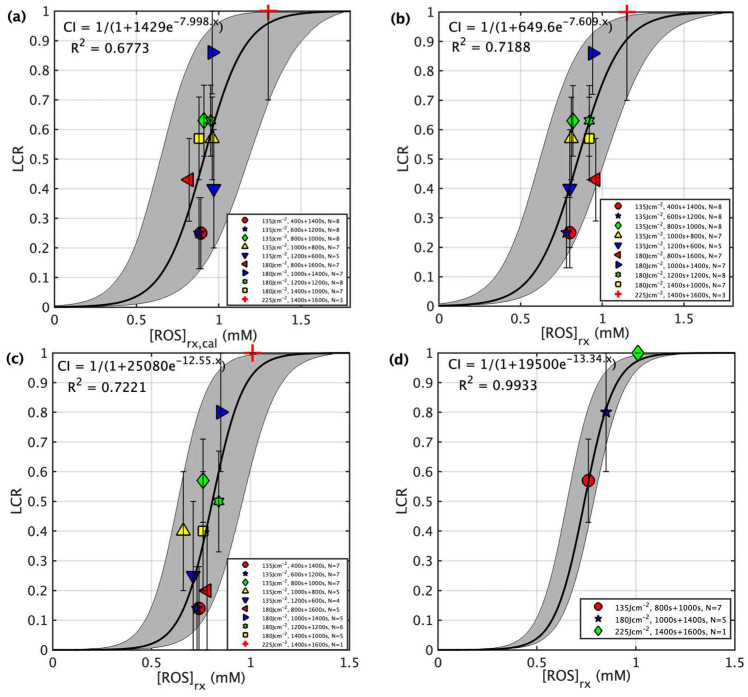
Figure 7.
LCR plotted against the reactive oxygen species at a depth of 3 mm for four scenarios: (a) for calculated reacted reactive oxygen species concentration ([ROS]rx,calc) at a 3 mm depth calculated using Equations (2)–(4) and the parameters summarized in Table 1, (b) for measured reacted oxygen species ([ROS]rx) at a 3 mm depth for all individuals (Table 2), (c) for all fractionated groups (Table 3), and (d) for groups with optimized treatment schemes (Table 3). For (c,d), individuals with a total [ROS]rx ≥ 1.1 mM are excluded. The solid lines show the best fit to the data with functional forms CI = 1/(1 + 1429e − 7.998x), 1/(1 + 649.6e − 7.609x), 1/(1 + 25,080e − 12.55x), and 1/(1 + 19,500 − 13.34x) with R2 = 0.6773, 0.7188, 0.7221, and 0.9933 for (a–d), respectively. The gray region indicates the upper and lower bounds of the fit with a 90% confidence level. As shown in (c), the resulting gray area for the optimized groups is significantly narrower, owing to the inclusion of the effects of light fractionation.

