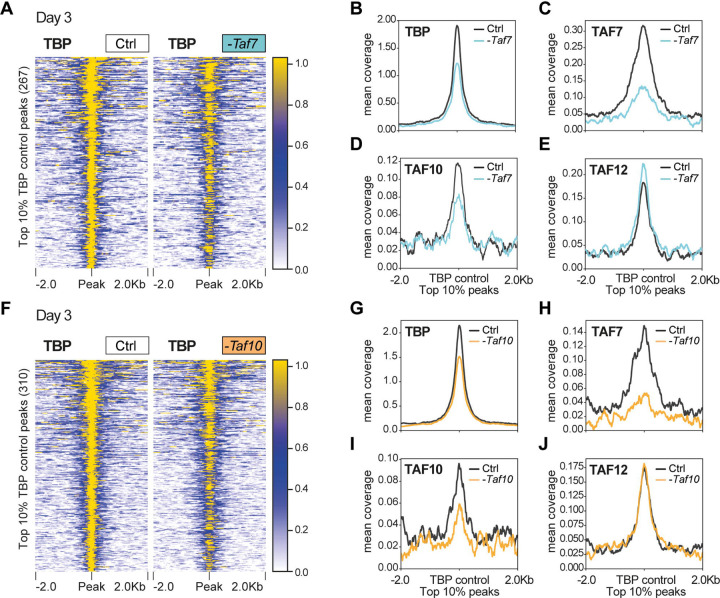
Figure 4: TBP is still recruited at promoters in TAF7 or TAF10-depleted mESCs.
(A) Heatmap showing the TBP distribution at the position of the top 10% (fold enrichment) TBP CUT&RUN peaks (± 2 kb) detected in the control condition, in RT7 control (Ctrl) and TAF7-depleted (-Taf7) mESCs after 3 days of treatment. (B-E) Mean profile of TBP (B), TAF7 (C), TAF10 (D) and TAF12 (E) protein accumulation at the location of the TBP control peaks, in control (black line) and in TAF7 depleted (blue line) mESCs. (F) Heatmap showing the TBP distribution at the position of the top 10% TBP CUT&RUN peaks (± 2 kb) detected in the control condition, in RT10 control (Ctrl) and TAF10-depleted (-Taf10) mESCs after 3 days of treatment. (G-J) Mean profile of TBP (G), TAF7 (H), TAF10 (I) and TAF12 (J) protein accumulation at the location of the TBP control peaks, in control (black line) and in TAF10 depleted (orange line) mESCs.

