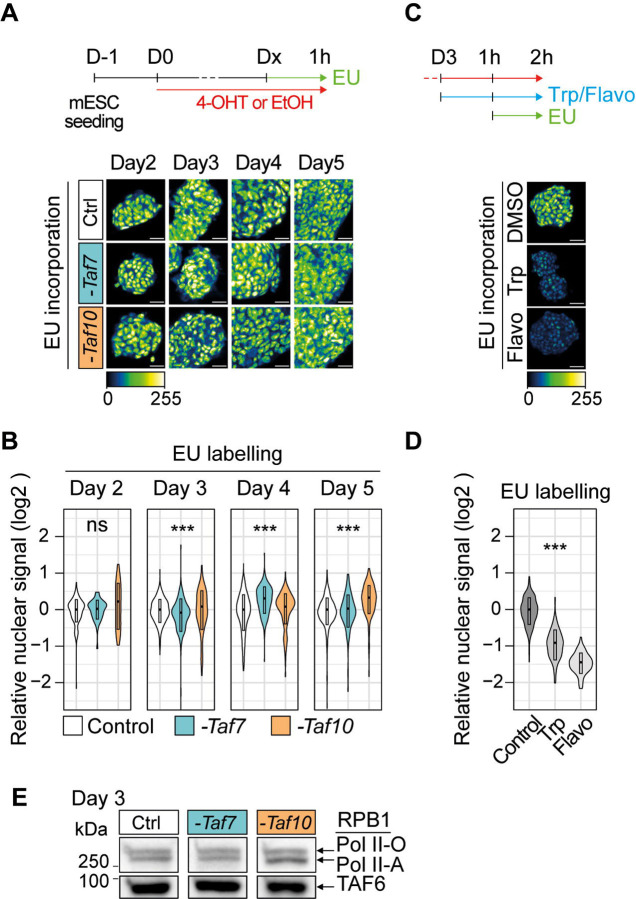
Figure 5: Depletion of holo-TFIID in absence of TAF7 or TAF10 has only limited defects on Pol II global transcription.
(A,B) Analysis of nascent transcription by one hour incubation with 1 mM of 5-ethynyluridine (EU) after 2 to 5 days of 4-OHT (-Taf7 or -Taf10) or EtOH (Control) treatment labeling in RT7 and RT10 cells after 2 to 5 days of 4-OHT (-Taf7 or -Taf10) or EtOH (Control) treatment. The time course of the experiments is indicated at the top. Representative pictures and quantification presented as violin plots are shown in (A) and (B), respectively. D2; two biological replicates (n=2), D3; n=3, D4; n=3, D5; n=2. (C,D) EU incorporation in control cells after 2 hours of treatment with Pol II transcription inhibitors (500 μm of triptolide (Trp) or 300 μM of flavopiridol (Flavo)). Representative pictures and quantification presented as violin plots are displayed in (C) and (D), respectively (n=1). Hundreds of measurements for individual nuclei were performed for the quantification, scale bar: 50 μm. Kruskal Wallis test: ns; not significant, *<0.05; **<0.01; ***<0.001. (E) Western blot analysis of the phosphorylated forms of RBP1 using an anti-RBP1 antibody from chromatin extracts of EtOH-treated RT7 mESCs (Ctrl) and 4-OHT treated RT7 (-Taf7) and RT10 (-Taf10) mESCs after 3 days of treatment. The hyper-phosphorylated RPB1 (Pol II-O, active) and hypo-phosphorylated (Pol II-A) are indicated on the right. At the bottom anti-TAF6 western blot analysis as loading control.

