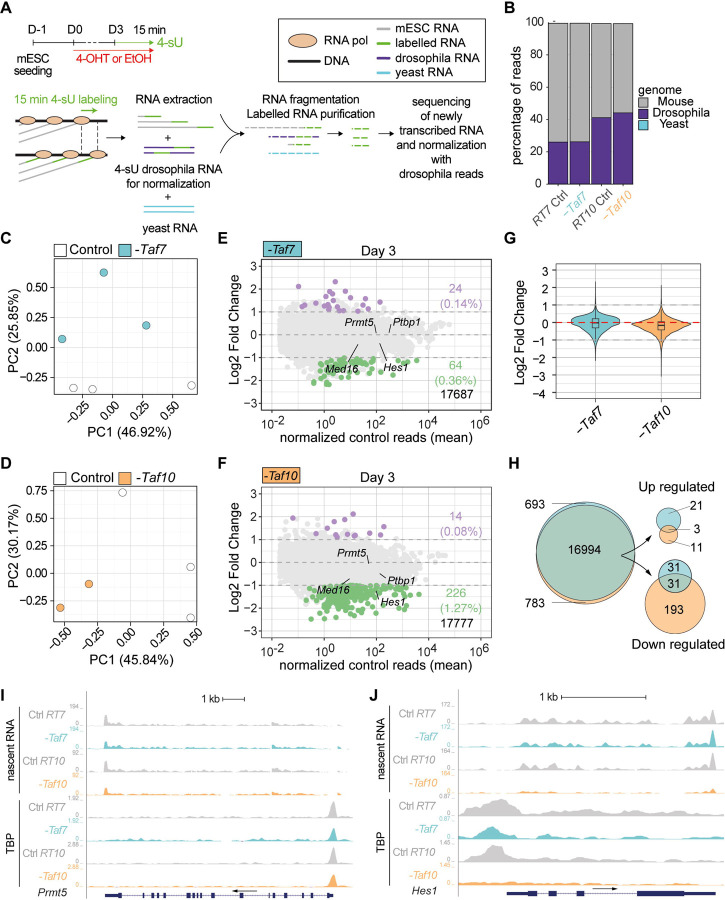
Figure 6: TAF7 loss has a milder impact on RNA pol II gene transcription than TAF10 loss after 3 days of treatment.
(A) Time course and scheme of the nascent RNA sequencing. After three days of treatment with 4-OHT (-Taf7 and -Taf10 for mutant RT7 and RT10 mESC, respectively) or EtOH (Control), nascent transcripts were labeled with 4-sU during 15 minutes. 4-sU labelled RNA from Drosophila S2 cells were used as spike for normalization and unlabelled yeast RNA as a control for the purification of the nascent transcripts. (B) Percentage of mouse (grey), Drosophila (purple) and yeast (cyan) reads in the different datasets. (C-D) Principal component analysis (PCA) of the nascent transcriptomes of RT7 (C) and RT10 (D) control (white dot) and mutant (colored dot) mESCs. (E,F) MA plots of 4-sU-seq from D3 mutant versus control RT7 (E) and RT10 (F) with the number and percentage of significantly down- (green) or up-regulated (purple) protein coding transcripts displayed on the right and total transcripts detected at the bottom. A threshold of 20 normalized reads per gene length in kb was used to select actively expressed protein coding genes. Significance transcripts were filtered using an adjusted P value ≤ 0.05 and an absolute Log2 Fold Change ≥ 1. (G) Comparisons of global Log2 fold changes in TAF7- and TAF10-depleted mESCs. (H) Venn diagrams analysis of all (left), up-regulated (top, right) and down-regulated (bottom, right) protein coding transcripts in TAF7- and TAF10-depleted mESCs. (I,J) UCSC genome browser views of nascent RNA (top) and TBP distribution (bottom) at Prmt5 (I) and Hes1 (J) loci between control (Ctrl RT7 and Ctrl RT10), TAF7 depleted (-Taf7) and TAF10 depleted (-Taf10) mESCs. Y axes indicate the genomic coverage. Arrows indicate direction of transcription.

