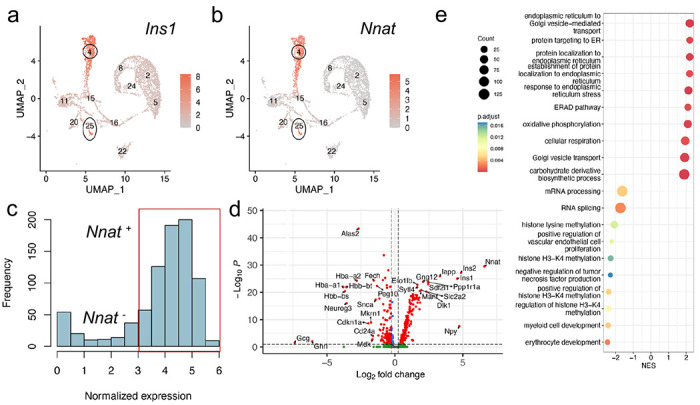
Fig. 2. Transcriptomic analysis of islet cells at E17.5 reveal Nnat+ cells to be a more differentiated beta cell subcluster.

(a, b) Islet cells plotted in the UMAP space and coloured by Ins1 (a) and Nnat (b) expression, respectively. Individual cellular clusters are labelled. Beta cell clusters are highlighted with black circles. (c) Distribution of Nnat expression among beta cell clusters, along with the expression range used in defining Nnat+ beta cells (highlighted by the red rectangle). (d) Volcano plot showing the log2 fold change in gene expression between Nnat+ and Nnat− beta cells against FDR-corrected P values. Genes with FDR < 0.1 are coloured red. Top 10 upregulated and downregulated genes are labelled by gene name. (e) Geneset enrichment analysis (GSEA) of differentially expressed genes between Nnat+ and Nnat− beta cells (using GO-BP terms), showing the top 10 upregulated and downregulated processes. The normalized enrichment score (NES) is plotted along the X-axis. Circle diameters are proportional to the number of genes in each process, with the colours defining statistical significance.
