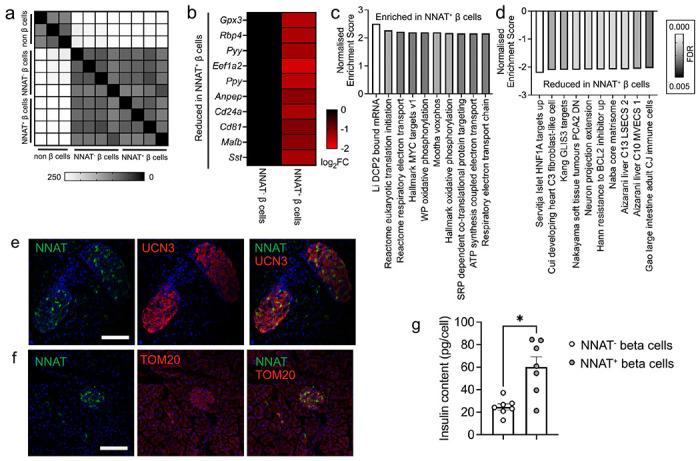
Fig. 7. NNAT+ adult beta cells are transcriptionally distinct and have significantly higher insulin content.

(a) Correlation matrix of differentially expressed genes between NNAT+ and NNAT− beta cells as assessed by RNA-sequencing analysis (n = 4 FACS-purified populations from individual mouse islet preparations). (b) Heatmap of top 10 most differentially expressed genes reduced in NNAT+ beta cells compared with NNAT− beta cells. (c, d) Gene set enrichment analysis (GSEA) showing categories significantly enriched (c) and reduced (d) in NNAT+ (vs NNAT−) beta cells. (e, f) Representative confocal microscopy of pancreatic cryosections from P56 (8 week old) wild type mice on a C57BL/6J background immunostained with antibodies against endogenous neuronatin (NNAT, green) and UCN3 (red, e) or TOM20 (red, f). Scale bar = 100μm, n = 3 mice. Nuclei are visualised with DAPI. Representative images from three independent experiments and breeding pairs. (g) Insulin content assessed in NNAT+ and NNAT− beta cells (* P < 0.05, n = 7 FACS-purified populations from individual mouse islet preparations, Wilcoxon matched-pairs signed rank test).
