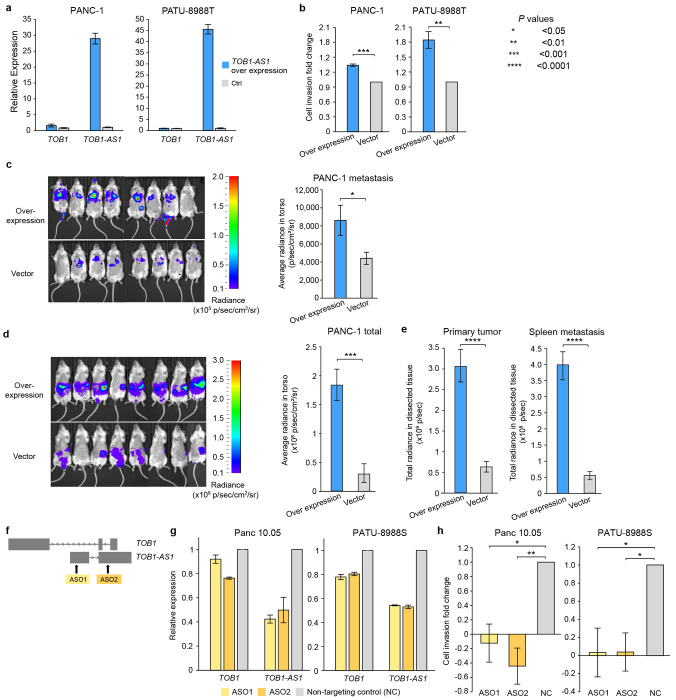
Figure 6. TOB1-AS1 promotes cell invasion and tumor metastasis.
a, TOB1-AS1 and TOB1 relative expression levels in PATU-8988T and PANC-1 cells transduced with TOB1-AS1 overexpression vector (n=3) or control vector (n=3). b, TOB1-AS1 overexpression in PATU-8988T (4 biological replicates) and PANC-1 (3 biological replicates) promoted in vitro cell invasion using Transwell assay. Each biological replicate was an independent experiment with 7 technical replicates per experimental group. The average fold change of cell invasion was calculated after the background invasion measured in the absence of any chemotactic agent was subtracted from each technical replicate. P values were calculated by two-sided student t test. c, TOB1-AS1 overexpression in PANC-1 cells promoted in vivo tumor metastasis in the tail vein injection model. d, TOB1-AS1 overexpression in PANC-1 cells exacerbated in vivo tumor growth and spontaneous metastasis in the orthotopic tumor model. Images of radiance in immunodeficient mice are shown on the left while the quantifications of radiance are shown on the right. Eight mice were used in both overexpression group and the empty vector control. The images were analyzed by setting the regions of interest (ROIs) to mouse torsos and measuring the average radiance level (in p/sec/cm2/sr). e, Primary tumor burden and spleen metastatic burden were higher in the mice that were orthotopically injected with TOB1-AS1 overexpression PANC-1 cells. The bar plots show quantified total radiance with a set area (in p/sec). f, Targeting TOB1-AS1 by two ASOs. g, TOB1-AS1 knockdown in Panc 10.05 and PATU-8988S cells transduced with ASO1 (n=3), ASO2 (n=3) or non-targeting control ASO (NC) (n=3). h, TOB1-AS1 knockdown suppressed Panc 10.05 (3 biological replicates) and PATU-8988S (3 biological replicates) cell invasion in vitro. Cell invasion fold change calculation is the same as in b. Two-sided student t test was used. Error bars in all panels indicate standard error of the mean.

