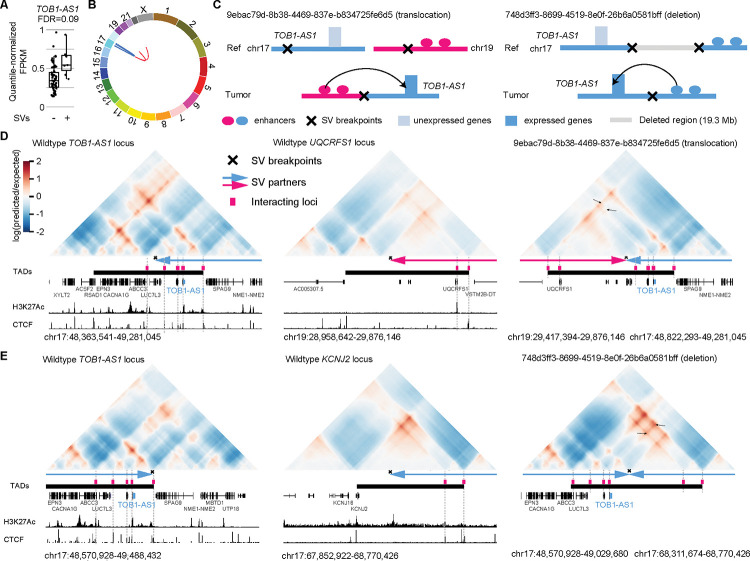
Figure 4. TOB1-AS1 activated by various types of SVs in pancreatic cancer.
A, Normalized expression of TOB1-AS1 in samples with (n=7) and without (n=67) nearby SVs in pancreatic cancers. The boxplot shows median values (thick black lines), upper and lower quartiles (boxes), and 1.5× interquartile range (whiskers). Individual tumors are shown as black dots. B, Circos plot summarizing intrachromosomal SVs (blue, n=5) and translocations (red, n=3) near TOB1-AS1. C, Diagrams depicting putative enhancer hijacking mechanisms that activate TOB1-AS1 in one tumor with a 17:19 translocation (left panel) and another tumor with a large deletion (right panel). D, Predicted 3D chromatin interaction maps of TOB1-AS1 (left panel), UQCRFS1 (middle panel), and the translocated region in tumor 9ebac79d-8b38-4469-837e-b834725fe6d5 (right panel). The downstream fragment of the chromosome 19 SV breakpoint was flipped in orientation and linked to chromosome 17. H3K27Ac and CTCF ChIP-Seq data of PANC-1 cell line are shown at the bottom. The expected level of 3D contacts depends on linear distance between two genomic locations. Longer distances correlate with fewer contacts. Akita predicts 3D contacts based on DNA sequences. The heatmaps are showing the ratio between predicted and expected contacts. The darkest red represent regions having 100 times more contacts than expected given the distance between the regions. E, Predicted 3D chromatin interaction maps of TOB1-AS1 (left panel) and KCNJ2 (middle panel) loci without deletion as well as the same region following deletion in tumor 748d3ff3-8699-4519-8e0f-26b6a0581bff (right panel).

