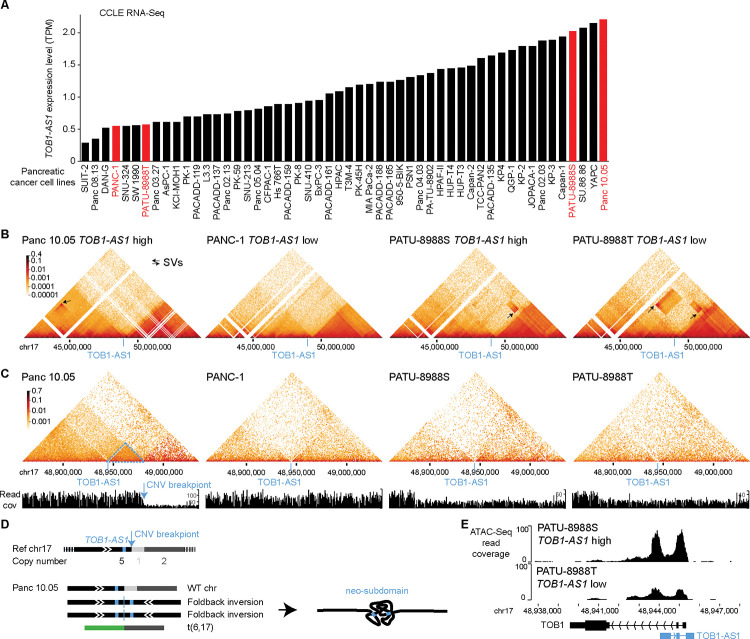
Figure 5. 3D genome structures in the TOB1-AS1 locus in pancreatic cancer cell lines.
A, TOB1-AS1 expression in pancreatic cancer cell lines in CCLE. The cell lines in red are selected for further studies. B and C, 3D genomic interactions in four pancreatic cancer cell lines. Black arrows represent SVs with off-diagonal interactions. The locations of TOB1-AS1 are marked by blue lines. In Panc 10.05, the blue arrow points to the CNV breakpoint and the dashed blue triangle represents the neo-subdomain formed due to the foldback inversion. D, The reference chromosome 17 and derived chromosomes in Panc 10.05. The chromosomes are not to scale. TOB1-AS1 is shown as small blue boxes in the chromosomes. E, Open chromatin measured by ATAC-Seq in PATU-8988S and PATU-8988T at the TOB1-AS1 locus.

