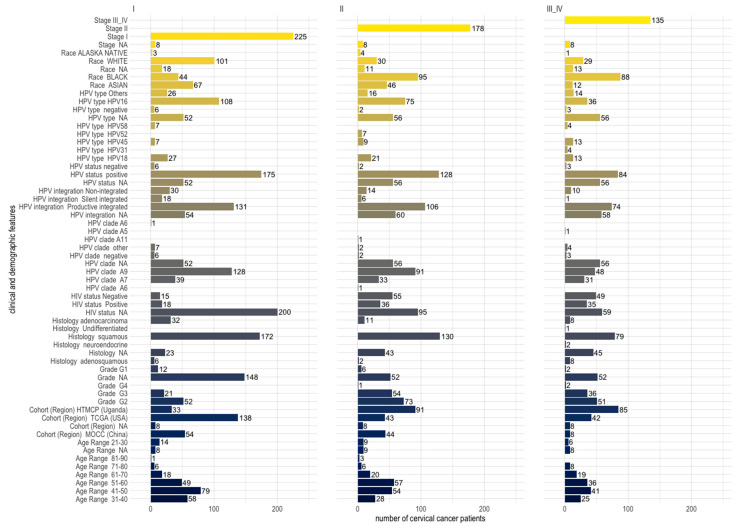
Figure 2.
Distribution of clinical and demographic features across stages I, II, and III and IV of 546 cervical cancer patients (comprising three different cohorts from the USA, China, and Uganda). Patients belonging to the 31–40 and 41–50 age groups are the majority at stage I, while patients of the 51–60 age group are the majority at stage II.

