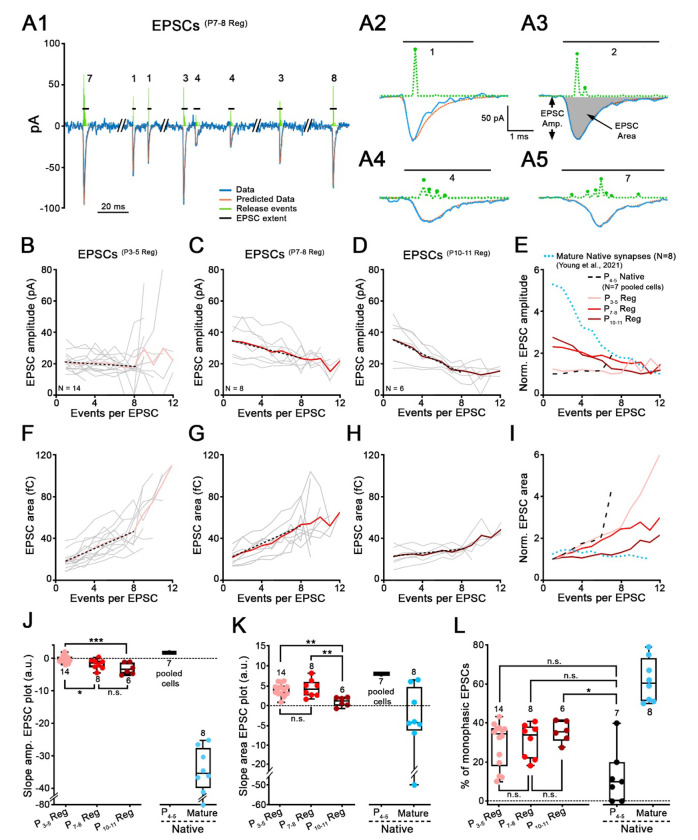
Figure 5. EPSC waveforms at synapses regenerated with older IHCs reveal properties closer to mature IHC ribbon synapses.
A, Modeling of EPSC waveforms using deconvolution. A1, Trace (blue line) of a SGN recording with 8 exemplar EPSCs(P7-8 Reg) recorded from a regenerated synapse. Holding potential: −79 mV. P7-8 denervated organ of Corti was plated for this co-culture with P0-2 SGNs. Four EPSCs from this recording are shown on extended time scales in A2-A5 (blue lines). A2, Monophasic EPSCs like this example, were averaged to create a kernel (standardized release event) for individual recordings. Kernels (amplitude and time-of-occurrence) are depicted in green dashed line above each EPSC. The fits calculated from the event sequences are shown in orange. EPSC amplitude (EPSC Amp.) and EPSC area (grey filled area) are defined in A3. Horizontal black lines represent EPSC extent and numbers indicate the smallest number of events (i.e., kernels) that best fit this EPSC. B-D, Mean values of regenerated EPSC amplitude are plotted against the number of events per EPSC, for three co-culture conditions, P3-5 (B, n=14 synapses, pink), P7-8 (C, n=8 synapses, red) and P10-11 (D, n=6 synapses, purple) denervated organ of Corti. Grey thin lines represent individual recordings and bold colored lines represent the averages. Black dotted lines represent the fit of the data, including only data with 1-8 events per EPSC, providing the slope values in J. E, EPSC amplitude versus events/EPSC plots were normalized to their minimum value and superimposed for different conditions. These include average traces for regenerated synapses from B-D, (P3-5 Reg, P7-8 Reg, P10-11 Reg; pink, red and purple), for immature P4-5 Native synapses (black dashed lines) and mature ribbon synapses (blue dotted lines, data from34). For EPSCs(P4-5 Native), EPSCs from the 7 recordings were pooled. F-I, Same as B-E, but with EPSC area plotted against number of events per EPSC. J, Slopes of the EPSC amplitude versus the number of events per EPSC calculated from B-E, are shown for each condition. EPSCs(P4-5 Native): 1.79 (n=7 pooled cells); EPSCs(P3-5 Reg): −0.32 (n=14); EPSCs(P7-8 Reg): −1.44 (n=8); EPSCs(P10-11 Reg): −3.26 (n=6) and EPSCs(mature native): −35.76 (n=8; data from34). One-way ANOVA with Tukey’s post hoc test. K, Slopes of the EPSC area versus the number of events per EPSC calculated from F-I, are shown for each condition. EPSCs(Native P4−5): 8.00 (n=7 pooled cells); EPSCs(P3-5 Reg): 4.33 (n=14); EPSCs(P7-8 Reg): 4.01 (n=8); EPSCs(P10-11 Reg): 1.7 (n=6) and EPSCs(mature native): −4.32 (n=8; data from34). One-way ANOVA with Tukey’s post hoc test. L, Percentage of monophasic EPSCs per recording is shown for each condition. EPSCs(Native P4-5): 10% (n=7); EPSCs(P3-5 Reg): 34.35% (n=14); EPSCs(P7-8 Reg): 34.04% (n=8); EPSCs(P10-11 Reg): 35.64% (n=6) and EPSCs(mature native): 60.50% (n=8; data from34). Kruskal–Wallis with Dunn’s post hoc test. J-L, Each data point represents an individual recording. Number of SGN recordings used for analysis is indicated. Boxes represent the median (horizontal line), 10th and 90th percentile. Whiskers represent maximum and minimum values of the distribution. *p<0.05, ***, **p <0.01, p<0.001, “n.s.”: not significant.

