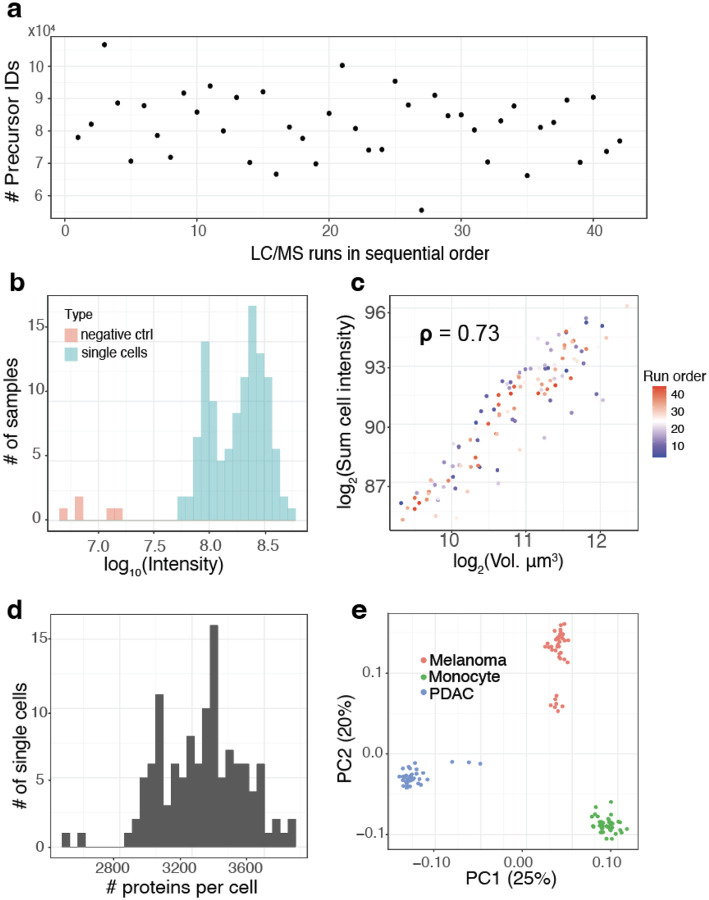
Figure 5 |. Comparison of throughput and reaction volume.
a, Number of identified precursors over the course of the LC-MS/MS runs. The numbers remained stable, indicating stable data acquisition. b, Distribution of the total signal (estimated as summed intensity from all peptides) for both single cells and negative controls, which have received trypsin and label but no cell. c, Cell volume has strong positive correlation with summed peptide signal as a proxy for total protein content indicating consistency of sample preparation. d, Distribution of the number of proteins quantified per cell. e, Principal component analysis shows that cells discretely cluster by cell type. The 2 clusters of melanoma cells correspond to previously characterized subpopulations in this cell line7.

