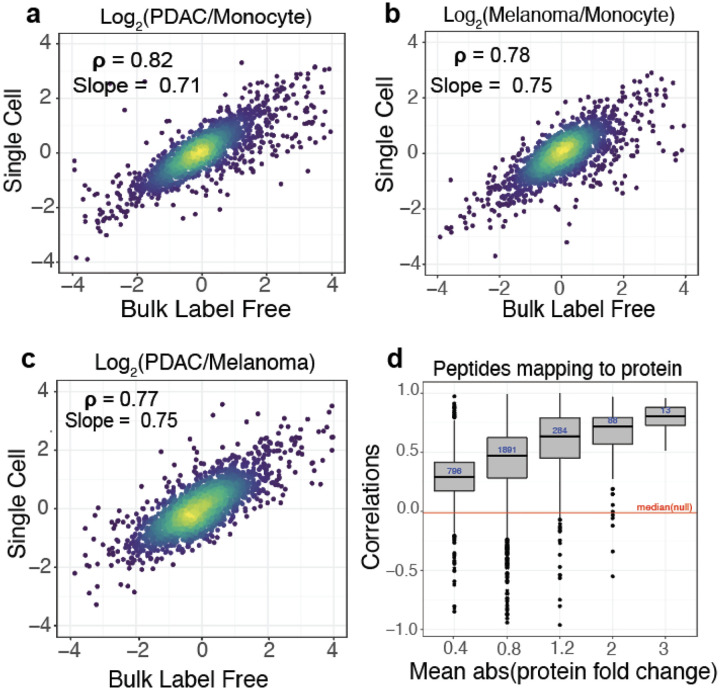
Figure 6 |. Evaluating quantitative accuracy.
All pairwise protein fold changes between the 3 cell types were estimated from single-cell plexDIA measurements using nPOP and from bulk samples analyzed by label free DIA. The corresponding estimates were compared on a log2 scale: a, PDAC / Monocyte b, Melanoma / Monocyte and c, PDAC / Melanoma. For each pair of cell types, single-cell fold changes were averaged in silico1. d, Consistency of protein quantification is estimated by the correlations among peptides mapping to (and thus likely originating from) the same protein. The distributions of these correlations are binned by the absolute fold change variation of the proteins. Proteins varying more across the single cells have higher correlations. The red line represents the median of the null distribution of correlations computed between peptides from different proteins. This plot is generated by QuantQC.

