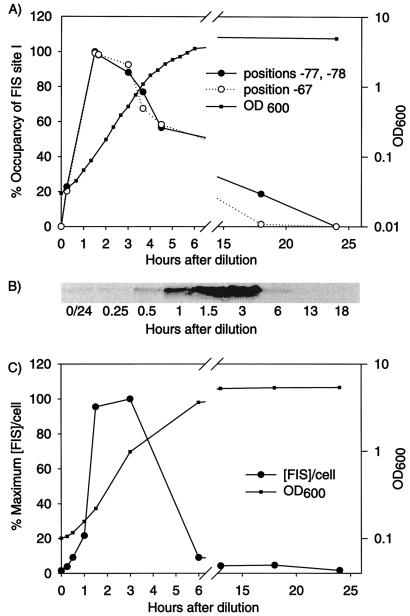
FIG. 3.
Occupancy of FIS site I and comparison with FIS levels in vivo. (A) rrnBp1 FIS site I occupancy after dilution from stationary phase. Percent occupancy was derived from protection of positions −67, −77, and −78 against DMS methylation (see the legend to Fig. 2B and Materials and Methods for details). Growth curve of a representative experiment is included. (B) FIS levels at various stages of growth. Extracts were prepared from RLG911 at the indicated times, and FIS levels were visualized on Western blots as described in Materials and Methods. The bands shown comigrated with purified FIS protein (data not shown). (C) Amounts of FIS in each band were quantified by using ImageQuant software (Molecular Dynamics) and normalized so that the maximum observed band intensity was equivalent to 100%. Growth curve of RLG911 cells sampled is shown.

