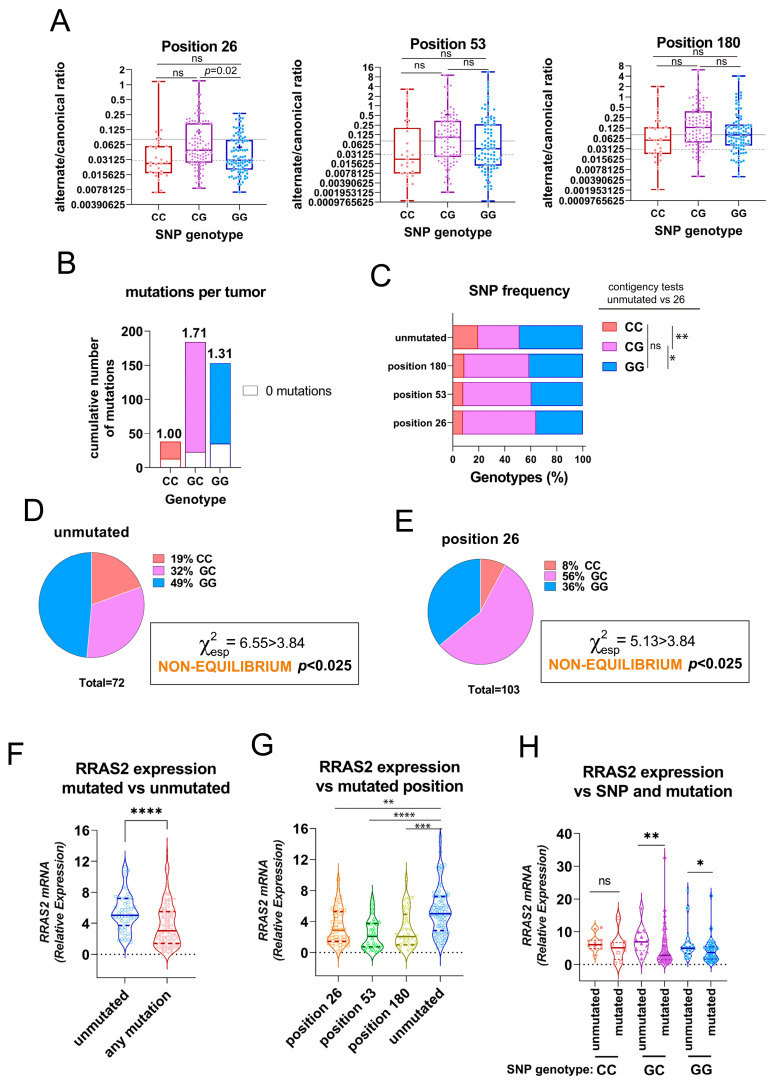
Figure 3.
The three somatic mutations in the 3′UTR of RRAS2 are associated with the SNP rs8570 in heterozygosity and lowering mRNA expression. (A) Box and whisker plots showing all the points and the median and the mean (cross, +) values of the alternate/canonical frequency ratios for each of the 3′UTR mutated positions, classified according to the SNP rs8570 genotype. Significance was assessed using a multiple comparison one-way ordinary ANOVA test. ns, not significant (p > 0.05). (B) Stacked bar plot showing the total number of mutations at the three 3′UTR positions in the patient CLL cohort classified according to the SNP rs8570 genotype. Inserted numbers indicate the average number of mutations detected per CLL sample. (C) Stacked bar plot showing the percentage of SNP rs8570 genotypes in CLL patients classified according to the presence of somatic mutations at the indicated 3′UTR positions. Contingency tests were carried out to compare two-by-two the frequencies of genotypes between the different mutant populations. A Chi-squared test with Yates’ correction was used to compute the p values. **, p = 0.005; *, p = 0.016; ns, not significant (p > 0.05). (D,E) Pie chart representation of the observed distribution of the GG, GC, and CC genotypes at the rs8570 SNP in blood samples of the cohorts of CLL patients bearing no mutations in the 3′UTR and bearing mutation at the +26 position. The Chi-squared value (χ2) is greater than 3.84 for both groups such that the hypothesis that genotypes are at Hardy–Weinberg equilibrium is rejected with p < 0.025. (F) Violin plot showing all experimental points, the median, and the upper and lower quartiles for RRAS2 expression in all CLL patients in our cohort, classified according to the presence or not of any mutation in the 3′UTR. Significance was assessed using a non-parametric unpaired Mann–Whitney rank test (****, p < 0.0001). (G) Violin plot showing all experimental points, the median and the upper and lower quartiles for RRAS2 expression in all CLL patients in our cohort classified according to the presence or not of mutations at the indicated positions of the 3′UTR. Significance was assessed using a non-parametric unpaired Dunn’s multiple comparisons test (****, p < 0.0001; ***, p = 0.0002; **, p = 0.0016). (H) Violin plot showing all experimental points, the median, and the upper and lower quartiles for RRAS2 expression in all CLL patients in our cohort, classified according to the SNP rs8570 genotype and to the presence or not of mutations at the three positions of the 3′UTR. Significance was assessed using a non-parametric unpaired Mann–Whitney rank test (**, p = 0.0067; *, p = 0.017). ns, not significant (p > 0.05).

