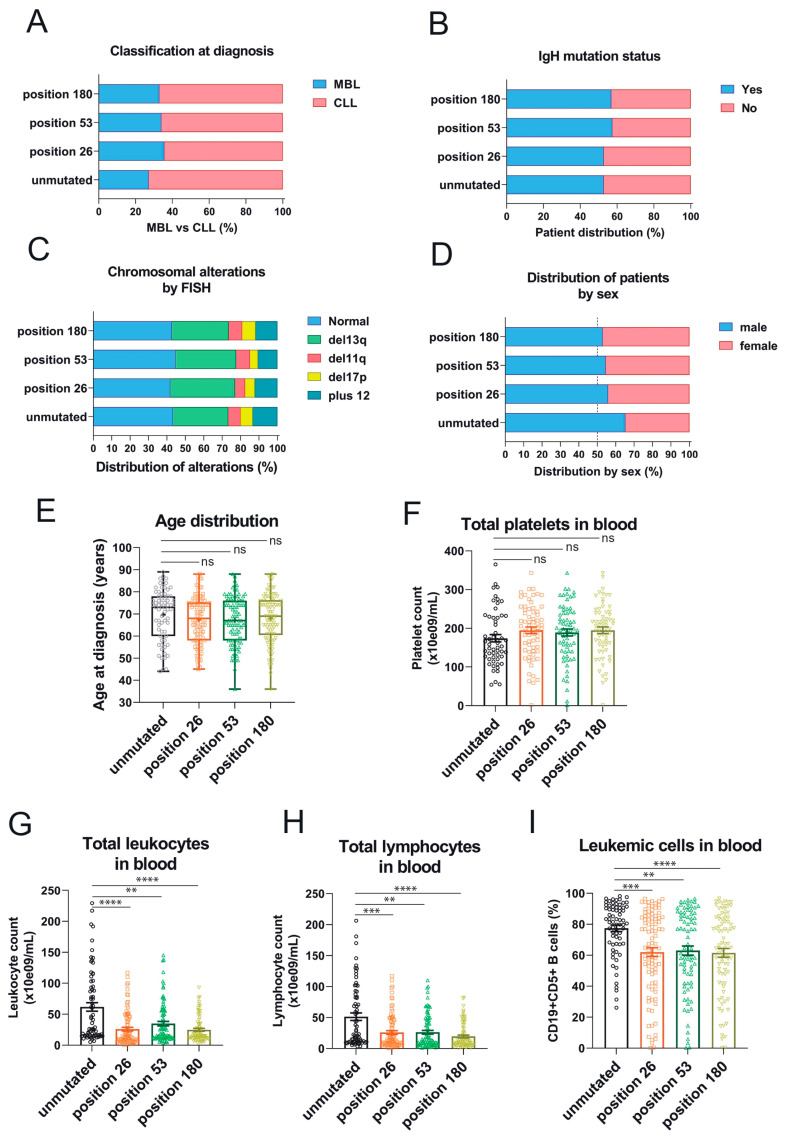
Figure 4.
The three somatic mutations in the 3′UTR of RRAS2 are associated with lower lymphocytosis in blood of CLL patients. (A) Stacked bar plot showing the percentage of patients with full-blown CLL or pre-malignant MBL at diagnosis, classified according to the presence or not of mutations at the indicated positions of the 3′UTR. Differences were not significant (p > 0.05) using an unpaired t-test. (B) Stacked bar plot showing the percentage of patients with leukemia bearing either mutated or unmutated IgHV, classified according to the presence or not of mutations at the indicated positions of the 3′UTR. Differences were not significant (p > 0.05) using an unpaired t-test. (C) Stacked bar plot showing the percentage of patients with leukemia bearing the indicated chromosomal anomalies and classified according to the presence or not of mutations at the indicated positions of the 3′UTR. Differences were not significant (p > 0.05) using a two-way ANOVA test. (D) Stacked bar plot showing the percentage of patients with leukemia classified according to their sex and to the presence or not of mutations at the indicated positions of the 3′UTR. Differences were not significant (p > 0.05) using contingency and Chi-squared tests. (E) Box and whisker plots showing all the points and the median and the mean (cross, +) values of the age at diagnosis for CLL patients bearing leukemias with mutations at the indicated positions. Significance was assessed using a non-parametric unpaired Dunn’s multiple comparisons test. ns, not significant (p > 0.05). (F) Scatter plot with bars showing all the points and the mean ± SEM values of the platelet concentration in blood of CLL patients. Significance was assessed using an ordinary one-way ANOVA test. ns, not significant (p > 0.05). (G,H) Scatter plots with bars showing all the points and the mean ± SEM values of the platelet concentration (G) and total lymphocytes (H) in blood of CLL patients. Significance was assessed using a non-parametric unpaired Dunn’s multiple comparisons test (****, p < 0.0001; ***, p = 0.0006; **, p = 0.0047). (I) Scatter plots with bars showing all the points and the mean ± SEM values of the percentage of leukemic CD19+CD5+ within blood lymphocytes in CLL patients. Significance was assessed using a non-parametric unpaired Dunn’s multiple comparisons test (****, p < 0.0001; ***, p = 0.0007; **, p = 0.0025).

