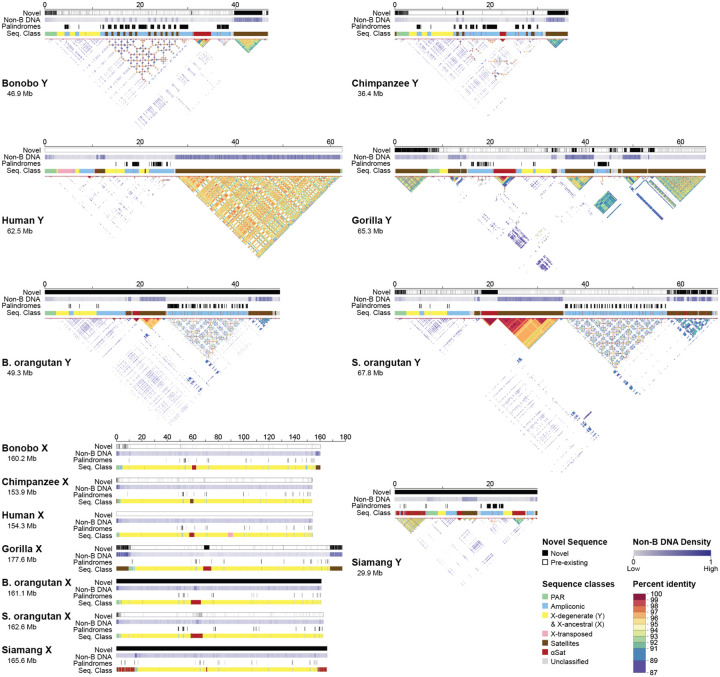
Figure 2. Sequences gained, palindromes, sequence classes, and intrachromosomal similarity in the assemblies.
Tracks for novel sequence relative to existing references (new in black), non-B DNA density (darker is more dense), palindromes (in black), and sequence classes (see color legend) are shown. The X and Y chromosomes are portrayed on different scales. No previous references existed for the Bornean orangutan or siamang, hence the solid black bars for the novel sequence tracks. No new sequence was added to the existing T2T human reference in this study and thus the human novel sequence tracks are empty (white). Self-similarity dot plots are also shown for the Y chromosomes (see percent identity legend). While these dot plots show the intrachromosomal similarity, the divergence between the Y chromosomes is also evident from the variable dot plot patterns. ‘B. orangutan’ and ‘S. orangutan’ stand for Bornean and Sumatran orangutan, respectively.

