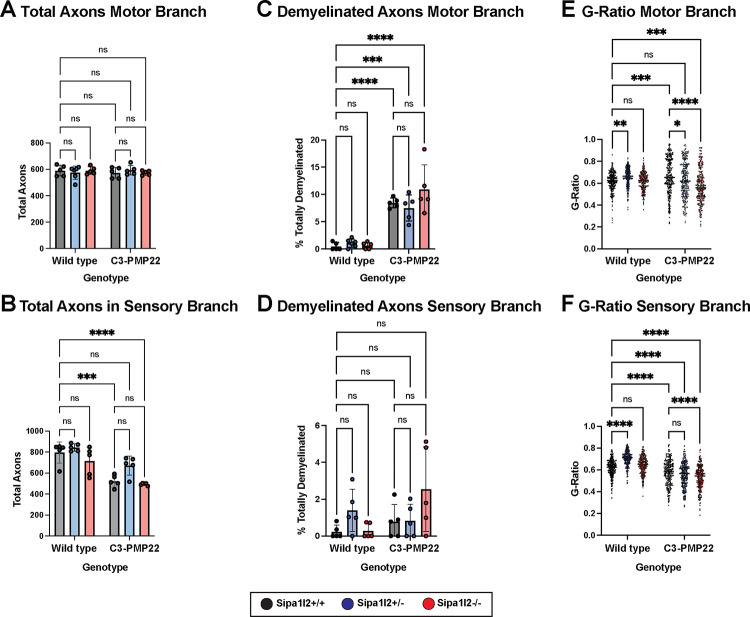
Figure 4 – Nerve Morphometrics from Femoral Nerve Motor and Sensory Branches.
A) Bar plot of the total number of axons in the motor branch of the femoral nerve. No differences are detected between genotypes. B) Bar plot of the total number of axons in the sensory branch of the femoral nerve. Significantly reduced numbers of axons are detected between both C3-PMP22 (p=0.0001) and C3-PMP22::Sipa1l2−/− (p<0.0001). C) Bar plot depicting the percentage of totally demyelinated axons in the motor branch of the femoral nerve. Significant reduction is detected for all genotypes expressing the C3-PMP22 transgene (C3-PMP22 and C3-PMP22::Sipa1l2−/− p<0.0001, C3-PMP22::Sipa1l2+/− p=0.0002). D) Bar plot of the percentage of demyelinated axons in the sensory branch of the femoral nerve. No differences were detected. E) Dot plot depicting G-Ratio of axons from the motor branch of the femoral nerve. Significant differences are detected between wild type and Sipa1l2+/− (p=0.0063), wild type and C3-PMP22 (p=0.0005), wild type and C3-PMP22::Sipa1l2−/− (p=0.0009). F) Dot plot depicting G-ratio of axons from the sensory branch of the femoral nerve. Significant differences are detected between wild type and Sipa1l2+/−, C3-PMP22, C3-PMP22::Sipa1l2+/−, and C3-PMP22::Sipa1l2−/− (all p<0.0001). For axon counts and myelination ratios, each datapoint indicates one mouse. For g-ratios, 50 axons were randomly selected for quantification from five mice. All comparisons are two-way ANOVA with either Dunnett’s multiple comparisons test (axon counts) or Tukey’s multiple comparisons test (Percent demyelinated axons and G-ratios). Error bars depict standard deviation.

