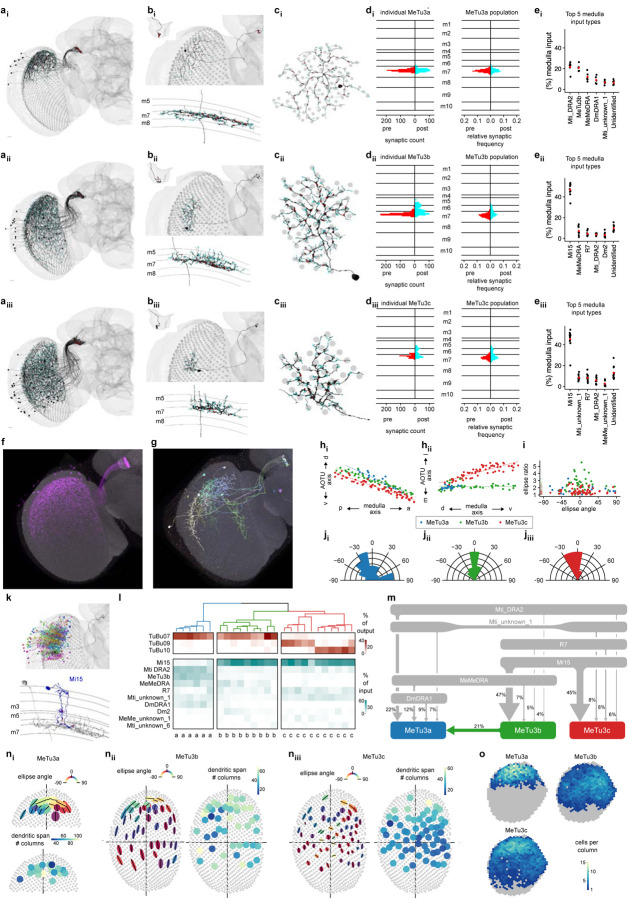
Fig. 4 |. Three subtypes of MeTu3 are functionally segregated.
ai-iii, Entire population of MeTu3a/b/c neurons respectively of the right hemisphere. Presynapses are red and postsynapses are cyan. bi-iii, Top: Single MeTu3a/b/c neuron respectively, with a closeup of the AOTU portion in the top-left corner. Bottom: Side view of the same, with the medulla layers labeled on the left. ci-iii, Top view of the same neurons in (bi-iii), with the medulla columns it spans as gray circles. di-iii, Synapse distribution of presynapses (red) and postsynapses (cyan) of the neurons in (bi-iii) with reference to the medulla layers. Right: Synapse distribution of all MeTu3a/b/c respectively with reference to the medulla layers (relative frequency). ei-iii, Percentage of medulla input (%) of top 5 synaptic input types and unidentified types for all analyzed MeTu3a/b/c neurons respectively. f, Confocal image of a MeTu3b specific split-gal4 driver (SS00988). g, MCFO image of MeTu3b neurons (SS00988). h, Dorsal-ventral positions in the AOTU of all MeTu3a (blue), MeTu3b (green), and MeTu3c (red) neurons in the right hemisphere as a function of their posterior-anterior positions in the medulla. i, Ellipse ratios (semi-major axis to semi-minor axis) of all MeTu3 neurons of the right hemisphere as a function of the ellipse angles. ji-iii, Relative frequency of ellipse angles for all MeTu3a/b/c neurons in the right hemisphere respectively. k, Top: MeTu3b from (bii) in black, along with all presynaptic Mi15 partners. Bottom: Side view of same MeTu3b in gray, with a single Mi15 partner in blue. Mi15 to MeTu3b synapses in red. l, Connectivity dendrogram of all analyzed MeTu3a/b/c neurons (labeled on the bottom). Percentage of output (red) and input (cyan) to their top TuBu and upstream partners respectively. m, Diagram of the top inputs of MeTu3a (blue), MeTu3b (green), and MeTu3c (red) in the medulla, with line thickness denoting synaptic weight. n, Morphometric analysis of MeTu3a (ni), MeTu3b (nii), and MeTu3c (niii) neurons. First plot: Fitted ellipses with semi-major axes as black lines and the color of the ellipse as a function of the ellipse angle. Second plot: Number of columns spanned by each MeTu3 neuron of the right optic lobe. o, Number MeTu3a (top-left), MeTu3b (top-right), and MeTu3c (bottom-left) neurons each medulla column in the right optic lobe contains within its bounds. Gray columns have zero neurons.

