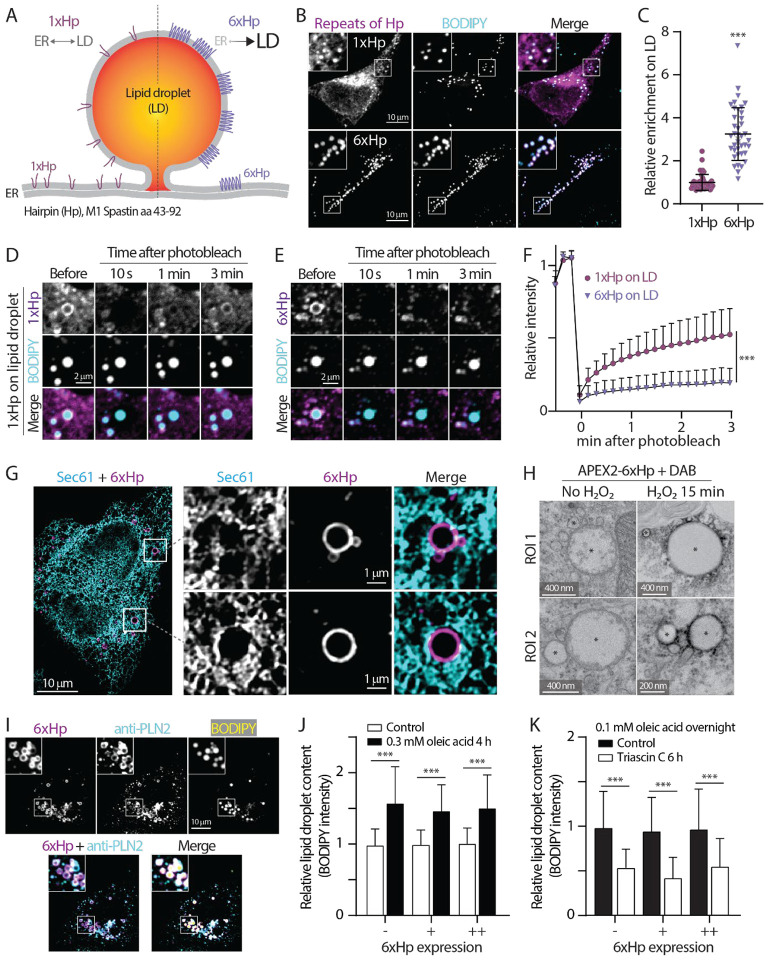
Figure 2. The design and validation of a synthetic lipid droplet targeting motif.
(A) Diagram depicting the ER and lipid droplet (LD) distribution of 1xHp (hairpin; amino acids 43–92 from human M1 Spastin) and 6xHp.
(B) Localization of BODIPY 493/503-labeled LDs and mApple-1xHp or mApple-6xHp in HeLa cells treated with 100 μM oleic acid (OA) overnight. Maximal intensity projected (MIP) confocal images from six axial slices (1.8 μm in total thickness) are shown.
(C) Quantification of relative enrichment of 1xHp and 6xHp on LD from (B). Raw data and mean ± standard deviation are shown (53–56 cells from three independent experiments).
(D and E) Fluorescence recovery after photobleaching (FRAP) of 1xHp (D) and 6xHp (E) on LDs in OA-treated U2OS cells labeled with BODIPY monitored by confocal microscopy.
(F) Quantification of FRAP of (D and E). Mean ± standard deviation are shown (22–37 cells from 3–4 independent experiments).
(G) Subcellular localization of Halo-6xHp relative to ER marker mEmerald-Sec61β in an OA-treated HeLa cell monitored by structured illumination microscopy. MIP images from ten axial slices (~2 μm in total thickness) are shown.
(H) Electron micrographs of LDs in U2OS cells expressing APEX2–6xHp incubated with DAB in the absence or presence of H2O2. * indicates representative LDs.
(I) Colocalization of Halo-6xHp and endogenous LD protein PLIN 2 in an OA-treated U2OS cell stained with BODIPY monitored by confocal microscopy. Representative images from a single axial plan (0.3 μm) are shown.
(J) Relative LD content in Halo-6xHp overexpressing HeLa cells under control condition or treated with 0.3 mM OA for 4 h. Mean ± standard deviation are shown (98–217 cells from three independent experiments). ‘-’ indicates absence of 6xHp expression. + and ++ indicate low and moderate expression of 6xHp, respectively.
(K) Relative LD content in OA-loaded, Halo-6xHp overexpressing HeLa cells under control condition or incubated with 10 μM Triacsin C for 6 h. Mean ± standard deviation are shown (169–499 cells from three independent experiments). ‘-’ indicates absence of 6xHp expression. + and ++ indicate low and moderate expression of 6xHp, respectively.

