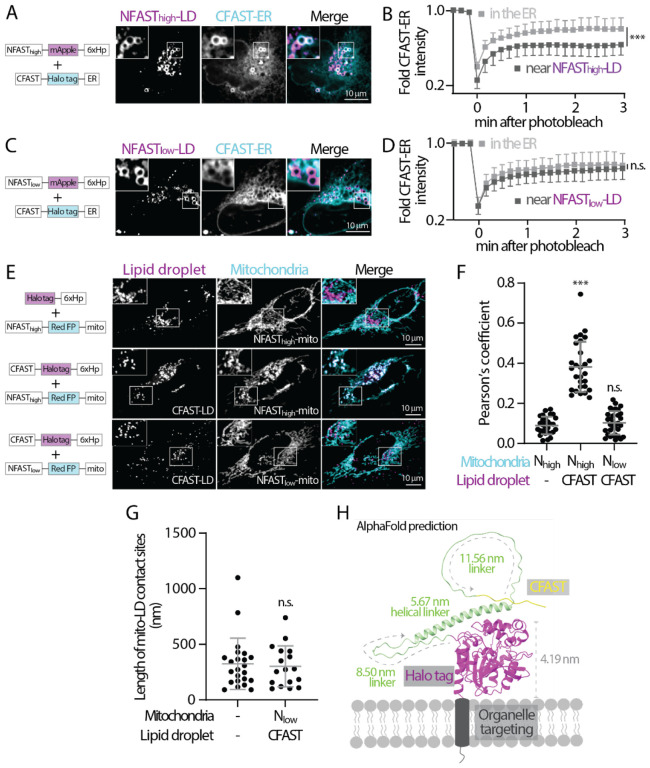
Figure 3. Low affinity splitFAST is suitable for implementing FABCON.
(A) Distribution of NFASThigh-mApple-6xHp and CFAST-Halo-ER in an oleic acid (OA)-treated U2OS cell. Representative images from a single axial plan are shown.
(B) Quantification of FRAP of CFAST-Halo-ER in the ER and near NFASThigh-decorated lipid droplets. Mean ± standard deviation are shown (24–25 regions from three independent experiments).
(C) Distribution of NFASTlow-mApple-6xHp and CFAST-Halo-ER in an OA-treated U2OS cell. Representative images from a single axial plan are shown.
(D) Quantification of fluorescence recovery after photobleaching (FRAP) of CFAST-Halo-ER in the ER and near NFASTlow-decorated lipid droplets. Mean ± standard deviation are shown (20–22 regions from three independent experiments).
(E) Distribution of lipid droplet and mitochondria in OA-treated HeLa cells overexpressing Halo-6xHp and NFASThigh-mApple-mito (top), CFAST-Halo-6xHp and NFASThigh-mApple-mito (middle), or CFAST-Halo-6xHp and NFASTlow-mApple-mito (bottom) monitored by confocal microscopy. Maximal intensity projected images from six axial slices (1.8 μm in total thickness) are shown.
(F) Quantification of the Pearson’s colocalization coefficient of lipid droplet and mitochondria described in (E). Raw data and mean ± standard deviation are shown (29–32 cells from three independent experiments).
(G) Quantification of the length of mito-LD contact sites detected by SEM in control and in FABmito-LD (see Figure S4B) infected HeLa cells. Raw data and mean ± standard deviation are shown (n=23 in control; n=17 in Nlow+CFAST).
(H) AlphaFold structure prediction of CFAST-linker-Halo displayed on a membrane bilayer. The size of Halo tag and length of flexible and helical linkers are indicated.

