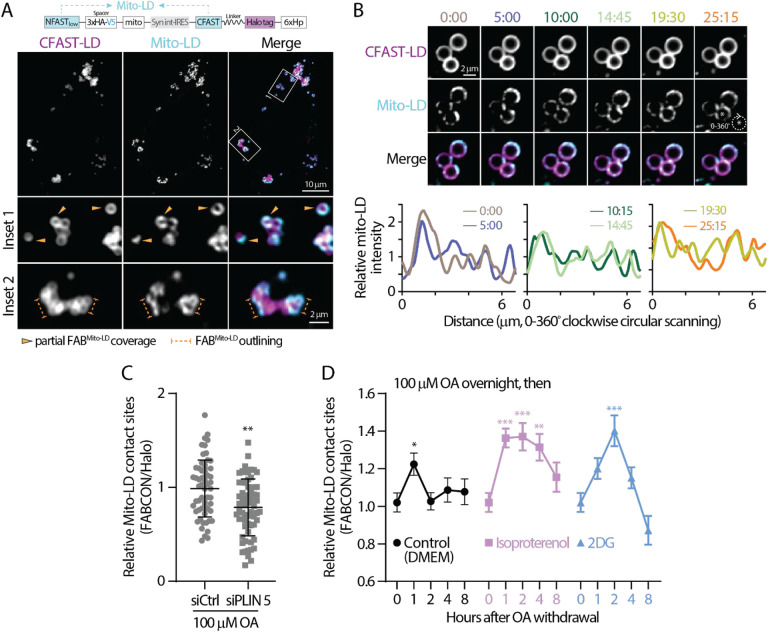
Figure 5. Dynamic regulation of mito-LD contact sites revealed via FABmito-LD.
(A) Detection of lipid droplets and mito-LD contact sites in oleic (OA)-treated HeLa cells producing FABmito-LD (top) monitored by confocal microscopy. Representative maximal intensity projected images from two axial slices (0.6 μm in total thickness) are shown.
(B) Dynamics of mito-LD contact sites on a lipid droplet in OA-treated U2OS cell producing FABmito-LD monitored by confocal microscopy over time (top). Relative intensity profiles of mito-LD measured by clockwise circular scanning are shown in bottom panels.
(C) Relative levels of mito-LD contact sites in OA-treated HeLa cells transfected with scramble or PLIN 5 siRNA. Raw data and mean ± standard deviation are shown (61–63 cells from three independent experiments).
(D) The temporal dynamics of mito-LD contact sites in OA-treated HeLa cells following OA withdrawal in DMEM and in DMEM with 10 μM of isoproterenol or 4 mM 2DG. Mean ± standard error are shown (37–58 cells from 3–4 independent experiments). Statistical significance was compared to time zero.

