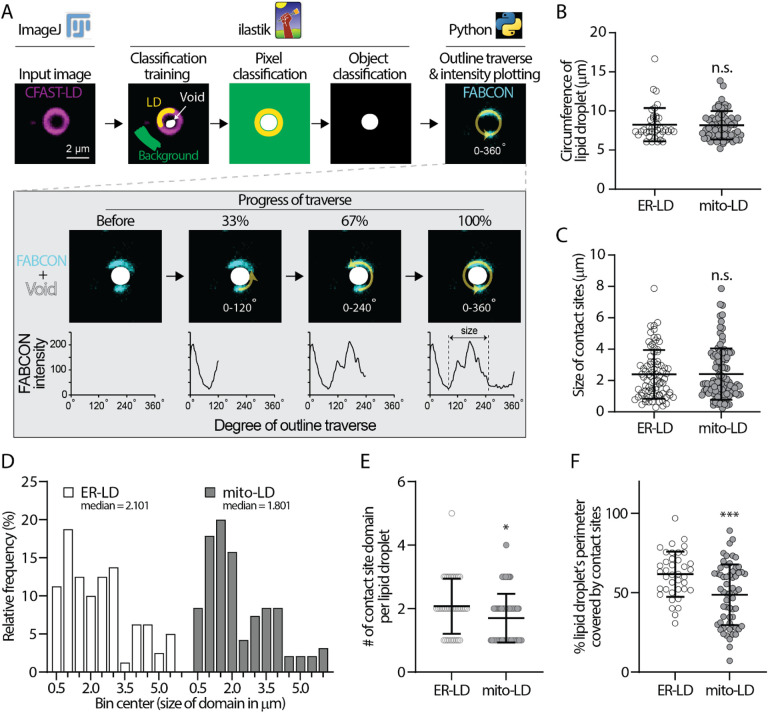
Figure 6. COSIMA analysis of ER-LD and mito-LD contact sites.
(A) A flowchart describing the COSIMA pipeline.
(B) Circumference of lipid droplets analyzed by COSIMA in ER-LD and mito-LD group. Raw data and mean ± standard deviation are shown (39–60 lipid droplets).
(C) Size of ER-LD and mito-LD contact sites measured by COSIMA. Raw data and mean ± standard deviation are shown (81–99 contact sites).
(D) Histogram of domain size of ER-LD and mito-LD contact sites.
(E) Number of ER-LD and mito-LD contact sites on each lipid droplet. Raw data and mean ± standard deviation are shown (39–60 lipid droplets).
(F) Fraction of lipid droplet’s perimeter covered by ER-LD and mito-LD contact sites. Raw data and mean ± standard deviation are shown (39–60 lipid droplets).

