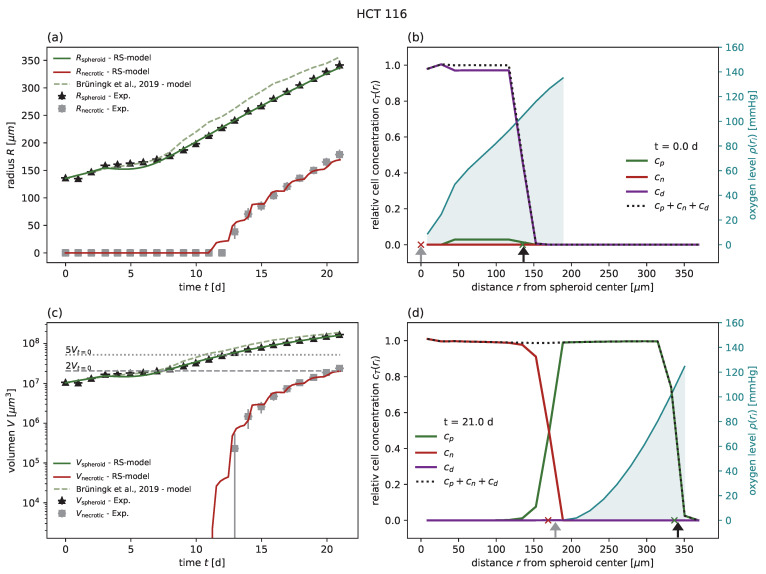
Figure 4.
(a) The RS model reproduces the outer radius (dark green) for the cell line HCT-116, with 5 Gy radiation experimental data from Brüningk et al. [1] (black crosses) even better than the model proposed along with the data (light green dashed). We used the parameters calibrated for untreated growth, the values for and fitted at 10 Gy, and the values and from Brüningk et al. [1]. Note that the necrotic radius during the experiment can be estimated (gray crosses) (see Section 3 for details) and that the RS model reproduces this necrotic radius (red). Additionally, note that the necrotic radius of the RS model appears jagged due to the spatial discretization of . The used parameters are reported in Table 1 and Table 2. (c) Volumes corresponding to the radii displayed in (a) in a semi-log plot. Multiples of 2 and 5 of the starting volume are highlighted with horizontal gray dashed and gray dotted lines, respectively. The RS model predicts the cell concentration over the radius at any time point. Examples show the cell distribution for (b) the first time point d and (d) the last day d of the experiment. Displayed are the cell concentrations of proliferation-competent cells (green solid) and membrane-defect cells (red solid), the total concentration of cells (black dotted), and the oxygen profile (blue solid, right y axis). The marker at the bottom of the panels (b,c) indicates the necrotic and outer radius estimated from the model (red and green crosses) and from the actual experimental data (gray and black arrows), respectively.

