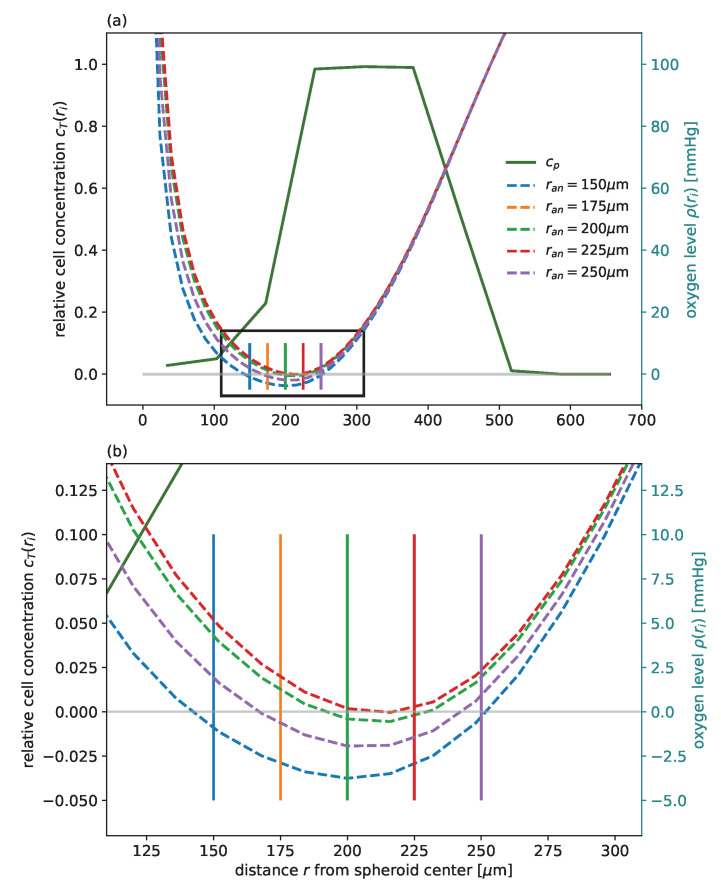
Figure A10.
Using bisection, the anoxic radius for the oxygen profile is determined by requiring the minima of the oxygen profile to be at , with . (a) Example cell concentration of oxygen consuming proliferation-competent cells (solid dark green) with corresponding oxygen profiles for different anoxic radii (dashed lines). We used the parameters calibrated for FaDu. (b) Magnification of the black box in (a) around the minima of the oxygen profiles. The solid vertical lines in corresponding colors highlight the anoxic radius for each oxygen profile. The correct radius determined by bisection is shown in red.

