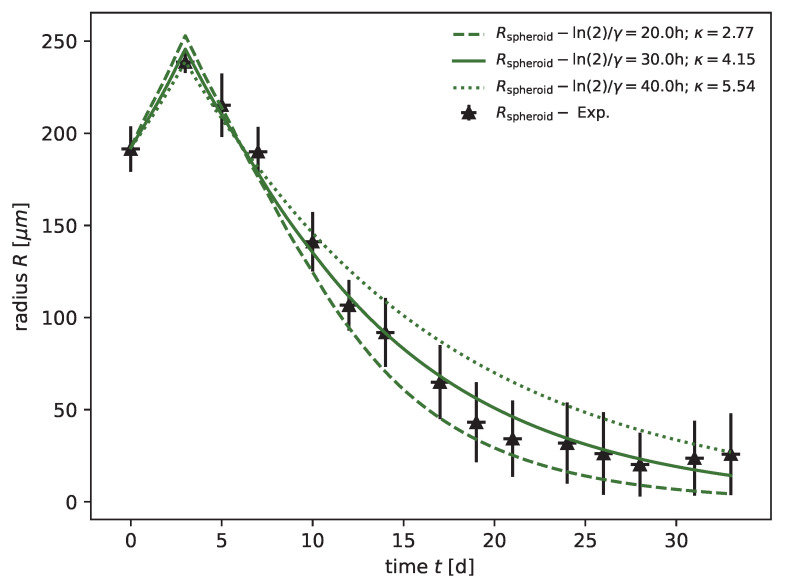
Figure A12.
The dynamics resulting from different choices of and can only be discriminated at small µm, where the transition between the linear and exponential regimes is observable. As an example, three choices of parameter sets with the same product (same slope in the linear regime) are displayed for the FaDu cell line with 20 Gy irradiation (the solid line corresponds to parameters in Figure A6). The time is varied in the fitting range used for the calibration of the RS model (20 h dashed line and 40 h dotted line).

