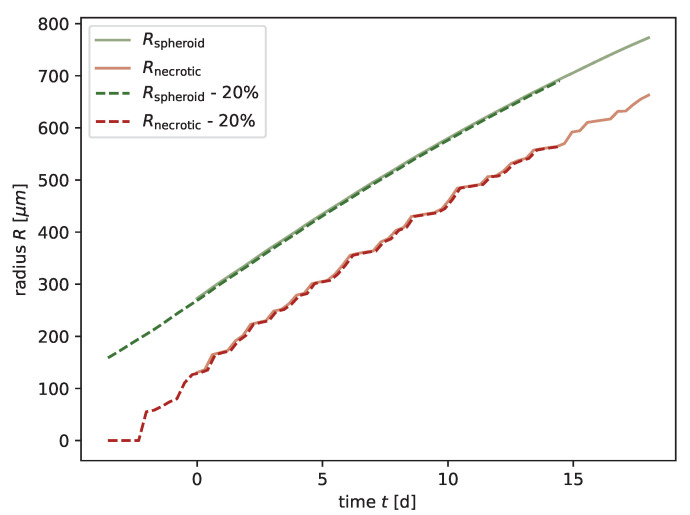
Figure A15.
The simulation result is independent of the starting condition. We compared two different starting cell concentrations for the radial-shell model. The brighter colors (solid) are from the simulation where the starting condition was set as described in Appendix J and used in all other simulations of the manuscript. The darker colored lines (dashed) are from a simulation in which the initial cell concentration was set with a relatively steep sigmoid function for of the starting volume. The same parameters were used for both simulations.

