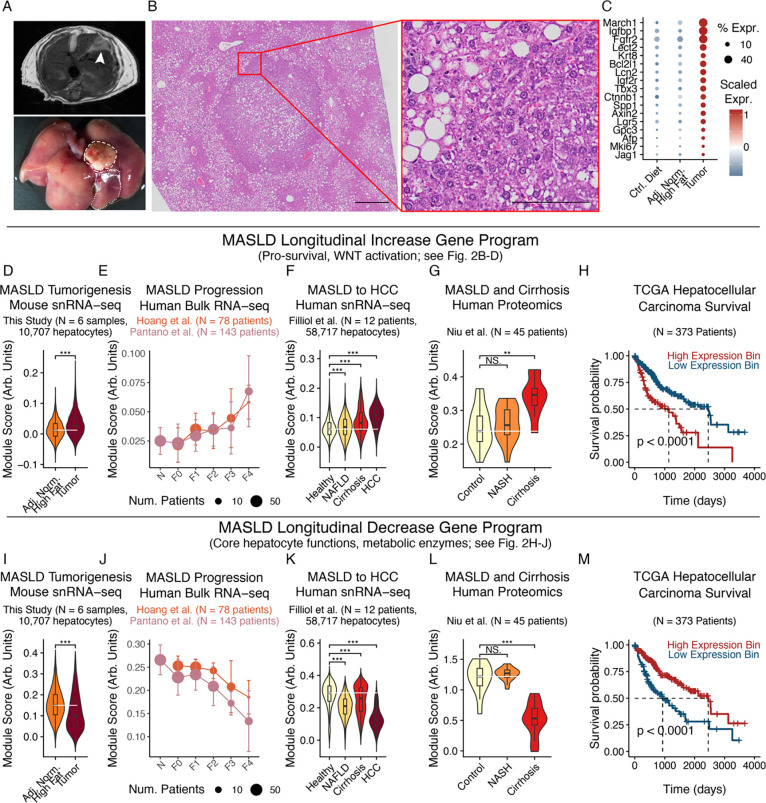
Figure 3: Chronic stress adaptations extend to human cohorts and connect to cancer phenotypes and outcomes.
(A) MRI (top) and gross imaging (bottom) of mouse model spontaneous HCC. Dashed line indicates tumor; dotted indicates adjacent normal. (B) H&E of mouse model spontaneous HCC (left scalebar=500μm; inset scalebar=100μm). (C) HCC marker expression in mouse model spontaneous tumors. (D-H) Longitudinal Increase program expression in mouse snRNA-seq tumor cells and adjacent normal hepatocytes (D), human bulk liver RNA-seq (E), human snRNA-seq hepatocytes and tumor cells (F), human bulk liver proteomics (G), or human HCC survival outcomes (H). (I-M) Longitudinal Decrease program expression, following (D-H). Survival outcome p-values calculated with log-rank test; all other p-values calculated using Mann-Whitney U test with Benjamini-Hochberg correction. * indicates p < 0.05; ** indicates p < 0.01; *** indicates p < 0.001.

