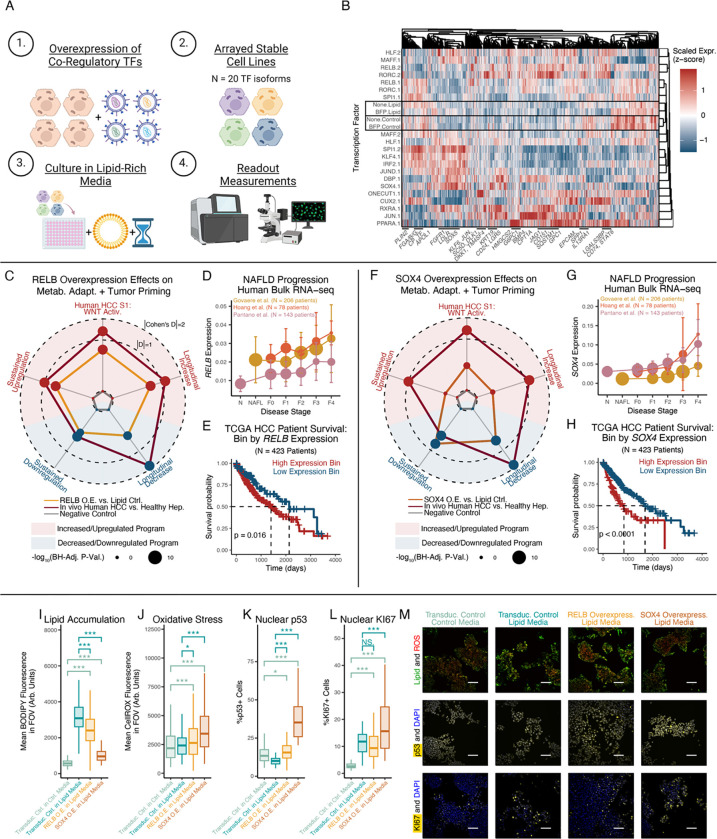
Figure 6: Human in vitro validation of RELB and SOX4 as regulators of hepatocyte metabolic (mal)adaptation.
(A) Experimental design schematic. (B) Pseudobulked TF expression profiles. Where applicable, “.1” and “.2” indicate isoforms of the same TF gene. (C) RELB’s effect sizes on gene program expression. Radius equals |Cohen’s D| if concordant directionality with human MASLD/HCC, and 0 if discordant. (D) RELB expression across human MASLD progression. (E) HCC human survival stratified RELB by expression. (F-H) Transcriptomic regulatory effects of SOX4, following (C-E). (I-L) Lipid accumulation (I; BODIPY 493), ROS accumulation (J; CellROX), nuclear p53 (K), and nuclear KI67 (L). (M) Representative microscopy images supporting (I-L) (scalebar=100μm). Survival outcome p-values calculated with log-rank test; all other p-values calculated using Mann-Whitney U test with Benjamini-Hochberg correction. * indicates p < 0.05; ** indicates p < 0.01; *** indicates p < 0.001.

