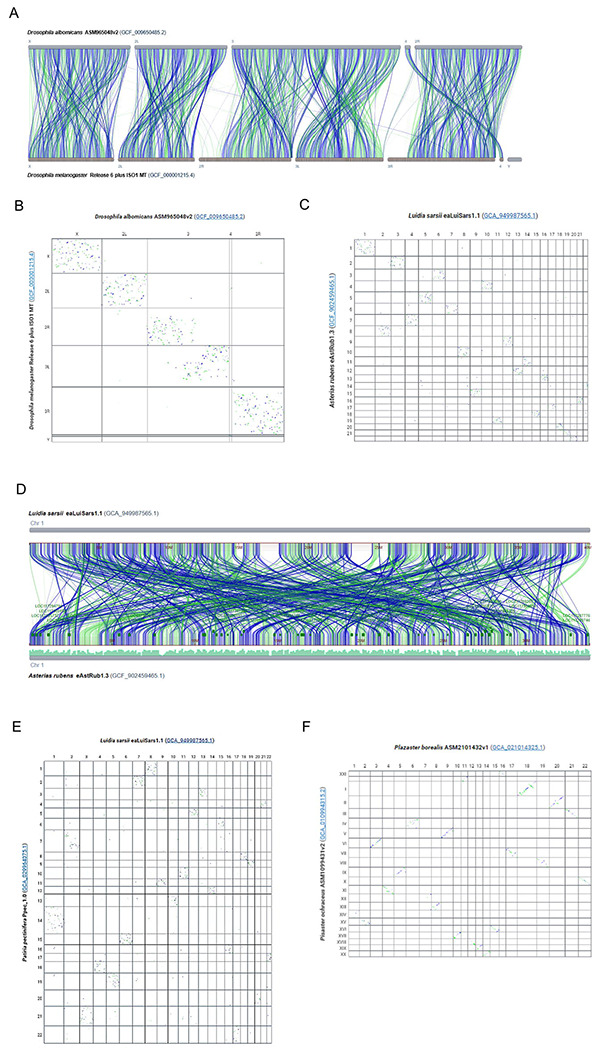
Fig 3. CGV shows conservation of linkage groups in the absence of conservation of gene order.

(A) CGV ideogram view of alignment between Drosophila albomicans and Drosophila melanogaster genomes. Alignments are restricted to a single chromosome or chromosome region.
https://ncbi.nlm.nih.gov/genome/cgv/browse/GCF_009650485.2/GCF_000001215.4/40865/0 (B)CGV dotplot view of alignment between Drosophila albomicans and Drosophila melanogaster demonstrates that sequence order is “scrambled” within linkage groups, as demonstrated by a scatter pattern indicating many short rearranged alignments. https://www.ncbi.nlm.nih.gov/genome/cgv/plot/GCF_009650485.2/GCF_000001215.4/40865/0 (C) CGV dotplot view of alignment between starfish species Luida sarsii and Asteria rubens with similar scatter pattern to Drosophila alignments.
https://www.ncbi.nlm.nih.gov/genome/cgv/plot/GCA_949987565.1/GCF_902459465.1/41045/0 (D) CGV ideogram view of alignment between chromosome 1 of Luida sarsii and chromosome 1 of Asteria rubens. These chromosomes align to each other across their length, but the alignment is broken into multiple short segments which are extensively rearranged.
https://www.ncbi.nlm.nih.gov/genome/cgv/browse/GCA_949987565.1/GCF_902459465.1/41045/0#OX465101.1/NC_047062.1/size=1,firstpass=0 (E) CGV dotplot view of alignment between starfish species Luida sarsii and Patiria pectinifera with similar scatter pattern to Drosophila alignments.
https://www.ncbi.nlm.nih.gov/genome/cgv/plot/GCA_949987565.1/GCA_029964075.1/41165/0 (F) CGV dotplot view of alignment between starfish species Plazaster borealis and Pisaster ochraceus. Alignments show less scatter and more of a diagonal slope, indicating more conservation of sequence order between these two species’ genomes. https://www.ncbi.nlm.nih.gov/genome/cgv/plot/GCA_021014325.1/GCA_010994315.2/41175/466999
