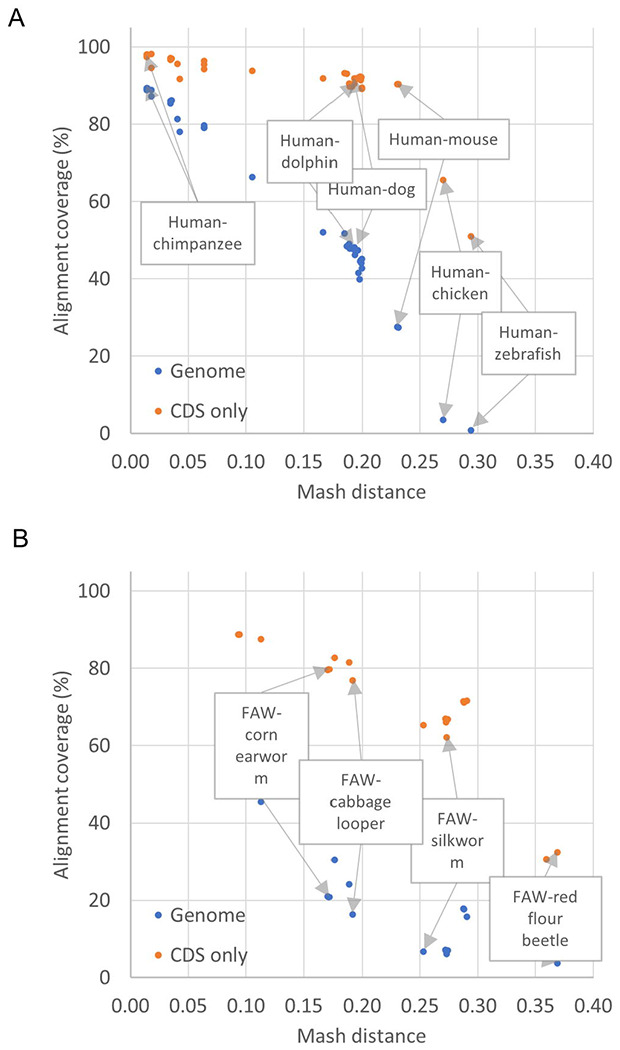
Fig 5. Genome and CDS coverage of assembly-assembly alignments relative to Mash distance.

Percentages of total target genome or CDS nucleotides covered by the ungapped alignments are plotted against the Mash distance between the pair of genomes. (A) Alignments between the human GRCh38.p14 assembly and other vertebrates. (B) Alignments of fall army worm (FAW, Spodoptera frugiperda, a major insect agricultural pest) and related insects. At lower Mash distances, the whole genome alignments cover most of the genome and CDS. At Mash distances greater than 0.25 or 0.3, the alignment covers less than 20% of the genome overall, and between 30% and 60% of the CDS. Refer to S1 Table for the data used to populate these graphs.
