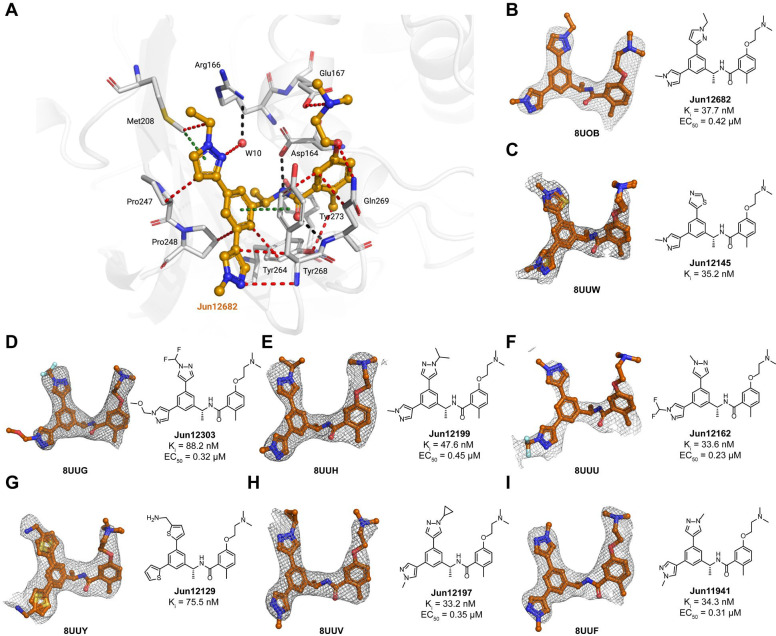
Fig. 3. X-ray crystal structures of SARS-CoV-2 PLpro with biarylphenyl PLpro inhibitors.
(A) Atomic model of the Jun12682 (in orange sticks and spheres) binding site in SARS-CoV-2 PLpro (residues within 5 Å of the inhibitor are shown in light gray sticks), with hydrogen bonds displayed in black dashed lines, van der Waals contacts as red dashed lines, and π–π interactions as light green dashed lines. (B-I) Gallery of the polder maps of the indicated inhibitors, displayed as a grey mesh with contour levels between 2 and 4σ. The PLpro inhibitory constant Ki in the FRET enzymatic assay and the SARS-CoV-2 antiviral activity EC50 in Caco-2 cells were shown for each compound.

