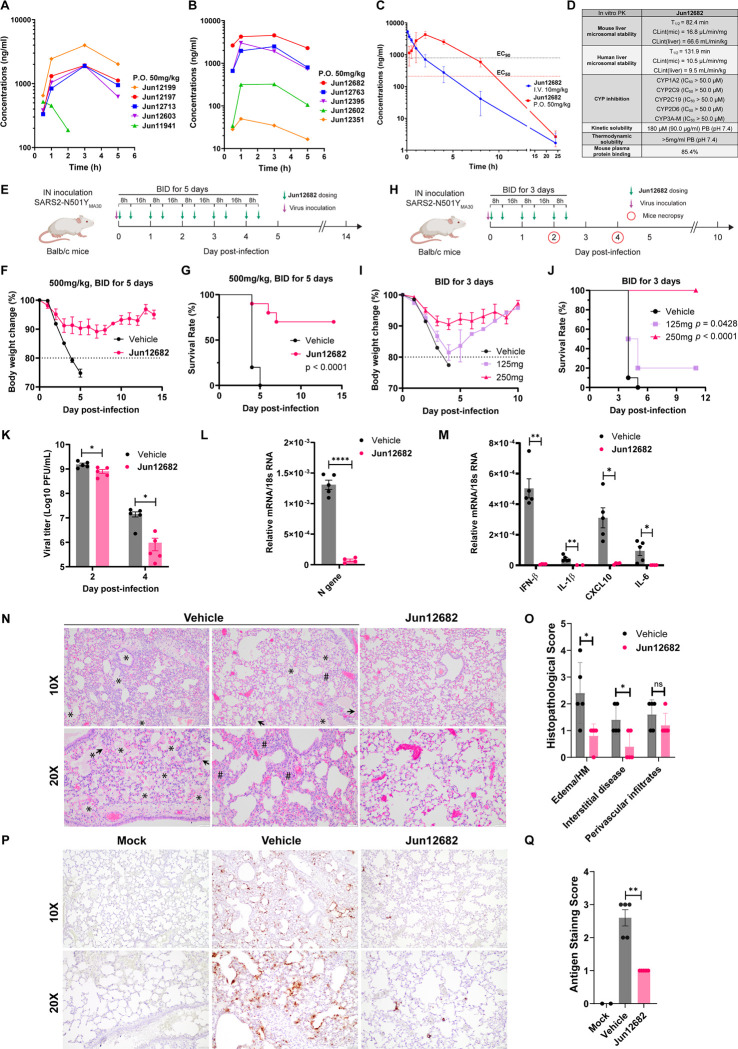
Fig. 4. In vitro and in vivo PK profiling of PLpro inhibitors, and in vivo antiviral efficacy of Jun12682.
(A) Plasma drug concentration of Jun12199, Jun12197, Jun12713, Jun12603, and Jun11941 in C57BL/6J mice (6 – 8 weeks old) following p.o. administration of 50 mg/kg of compound in 0.5% methylcellulose and 2% Tween 80 in water. (B) Plasma drug concentration of Jun12682, Jun12763, Jun12395, Jun12602, and Jun12351 in C57BL/6J mice (6 – 8 weeks old) following p.o. administration of 50 mg/kg of compound in 0.5% methylcellulose and 2% Tween 80 in water. (C) Plasma drug concentration of Jun12682 in C57BL/6J mice (6 – 8 weeks old) following p.o. administration of 50 mg/kg and i.v. injection of 10 mg/kg. (D) In vitro PK parameters of Jun12682. (E) Experimental design for the 5-day treatment experiment. Ten mice per group were intranasally (IN) inoculated with 5,600 PFU of SARS2-N501YMA30 and subsequently orally administered 500 mg/kg Jun12682 or vehicle twice a day (BID) for five days (BID_5). (F) Body weight loss and (G) survival rate of the BID_5 mice experiment. (H) Experimental design for the 3-day treatment experiment. Ten mice per group were intranasally (IN) inoculated with 5,600 PFU of SARS2-N501YMA30 and subsequently orally administered 125, 250 mg/kg Jun12682 or vehicle BID for three days (BID_3). (I) Body weight loss and (J) survival rate of the BID_3 mice experiment. Data in F, G, I, and J are pool of two independent experiments (n=10) and are shown as mean ± s.e.m. The p values in G and J were determined using a log-rank (Mantel–Cox) test. (K) Viral titers in lungs collected at 2 and 4 DPI from vehicle- or 250 mg/kg Jun12682-treated mice (n=5 each group). Data are mean ± s.e.m and analyzed with unpaired t test with Welch’s correction. *, p< 0.05; ***, p<0.001. (L-M) Quantitative PCR analysis of viral nucleocapsid gene (L) and cellular cytokines (M) in lungs collected at 2 DPI from vehicle- or 250mg/kg Jun12682-treated mice (n=5 each group). (N-Q) Lungs collected at 4 DPI from vehicle- or 250mg/kg Jun12682-treated mice (n=5 each group) were stained with haematoxylin and eosin (H&E) (N) or immunostained for SARS-CoV-2 nucleocapsid (P), and the pathological lesions and staining were quantified (O and Q, respectively). N, H&E stained lungs from vehicle-treated infected mice exhibited airway edema (asterisks), hyaline membranes (HM, arrowheads), and interstitial thickness (number sign). Scale bars, 100 μm (top) and 50 μm (bottom). O, Summary scores of lung lesions (n = 5 for each group). P, Lungs from vehicle- or Jun12682-treated mice (n = 5 for each treatment group) were immunostained to detect SARS-CoV-2 nucleocapsid protein. Scale bars, 100 μm (top) and 50 μm (bottom). Q, Summary scores of nucleocapsid immunostaining of lungs. Data in L, M, O and Q are mean ± sem and analyzed with unpaired t test with Welch’s correction. ns, not significant; *, p<0.05; **, p<0.01; ***, p<0.001; ****, p<0.0001.

