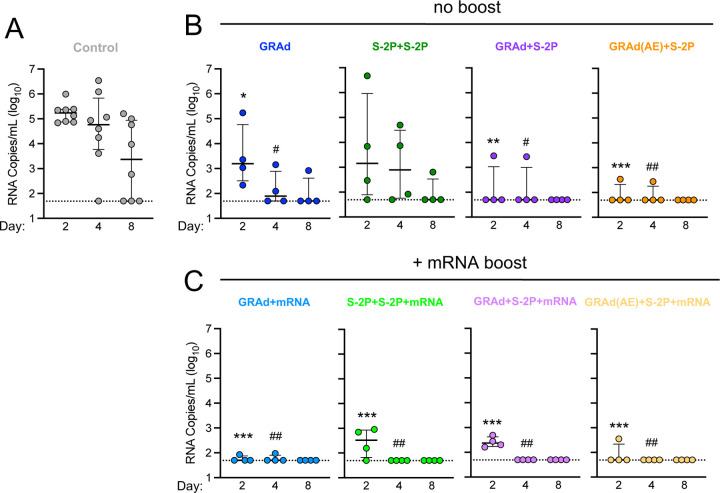
Figure 1. GRAd confers durable protection against BA.5 in the lower airway.
(A–C) BAL was collected at days 2, 4 and 8 following challenge with 8 × 10⁵ PFU BA.5.
(A) BA.5 sgRNA_N copy numbers per mL of BAL in control NHP.
(B) BA.5 sgRNA_N copy numbers per mL of BAL in GRAd, S-2P+S-2P, GRAd+S-2P and GRAd(AE)-S-2P NHP.
(C) BA.5 sgRNA_N copy numbers per mL of BAL in GRAd, S-2P+S-2P, GRAd+S-2P and GRAd(AE)-S-2P NHP boosted with mRNA at week 48.
Circles (A–C) indicate individual NHP. Error bars represent interquartile range with the median denoted by a horizontal line. Assay limit of detection indicated by a dotted horizontal line. Statistical analysis shown for corresponding timepoints between control and test group (e.g., ‘*’ symbols denote comparisons at day 2, ‘#’ symbols denote comparison at day 4). *,# p <0.05, **,## p <0.01, *** p <0.001. Eight control NHP and 4 immunized NHP per cohort.
See also Figure S1 for experimental schema, Figure S2 for BA.5 titration in NHP, Figure S3 for viral load and Figure S4 for lung pathology.

