Figure 1.
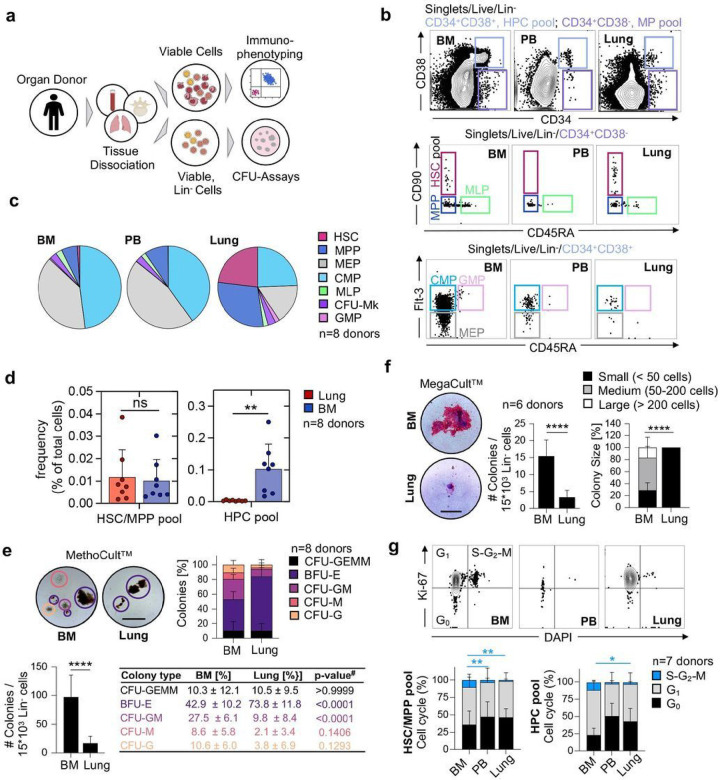
The human lung contains phenotypic hematopoietic progenitors with in vitro proliferation and differentiation capacity. (A) Pipeline for flow-cytometric immunophenotyping and evaluation of in vitro colony-forming capacity of hematopoietic progenitor cells from BM, lung and PB of organ donors. (B) Normalized flow cytometry plots of BM, PB in the Live/Lin− gate from a representative donor showing stem cell subsets within the multipotent (MP [CD34+CD38−], light purple) and the hematopoietic progenitor cell (HPC [CD34+CD38+], light blue) pool. HSC, hematopoietic stem cell; MPP, multipotent progenitor; MLP, multilymphoid progenitor; CMP, common myeloid progenitor; MEP, megakaryocyte-erythroid progenitor; GMP, granulocyte-macrophage progenitor; CFU-Mk, colony-forming-unit megakaryocyte. (C) Composition of hematopoietic progenitor subsets in the BM, PB and lung (n=8). (D) Frequency of cells in the HSC/MPP and HPC pool as a percentage of total nucleated cells in the lung or BM, respectively. Individual values are shown, bars represent mean ± SD. Student’s t-test, **p<0.01; ns, not significant. (E) Culture initiating capacity of lung and BM progenitors in MethoCultTM (n=8): Representative colonies (scale bar, 500μm), colony composition and colony quantity for progenitors derived from the BM and lung. Student’s t-test, ****p<0.0001, #ANOVA followed by Sidak’s multiple comparison test. CFU, colony-forming unit; BFU-E (purple), burst-forming unit-erythroid; G (orange), granulocyte; M (red), macrophage; GM (pink), granulocyte macrophage; GEMM (black), granulocyte, erythroid, macrophage, megakaryocyte. (F) Culture initiating capacity of lung and BM progenitors in MegaCultTM (n=6): Representative colonies (scale bar, 100μm), colony quantity and colony size for progenitors from the BM and lung. Bar graph represents mean number of colonies ± SD, Student’s t-test, ****p<0.0001. Stacked bars represent mean proportion ± SD, Kruskal-Wallis test, ****p<0.0001. (G) Proportions of cycling (S-G2-M phase (blue), Ki-67+DAPI+), preparing/growing (G1 (grey), Ki-67+DAPI−) and resting cells (G0 (black), Ki-67−DAPI−) in the HSC/MPP and HPC pool from BM, PB and lung (n=7). Stacked bars represent mean proportion ± SD, ANOVA followed by Sidak’s multiple comparison test, **p<0.01, *p<0.05. For comparisons not indicated, no statistically significant differences were observed.

